
Elegran Manhattan Market Update: June 2024

Contract Activity and Supply Increased Month-over-Month and Decreased Year-over-Year
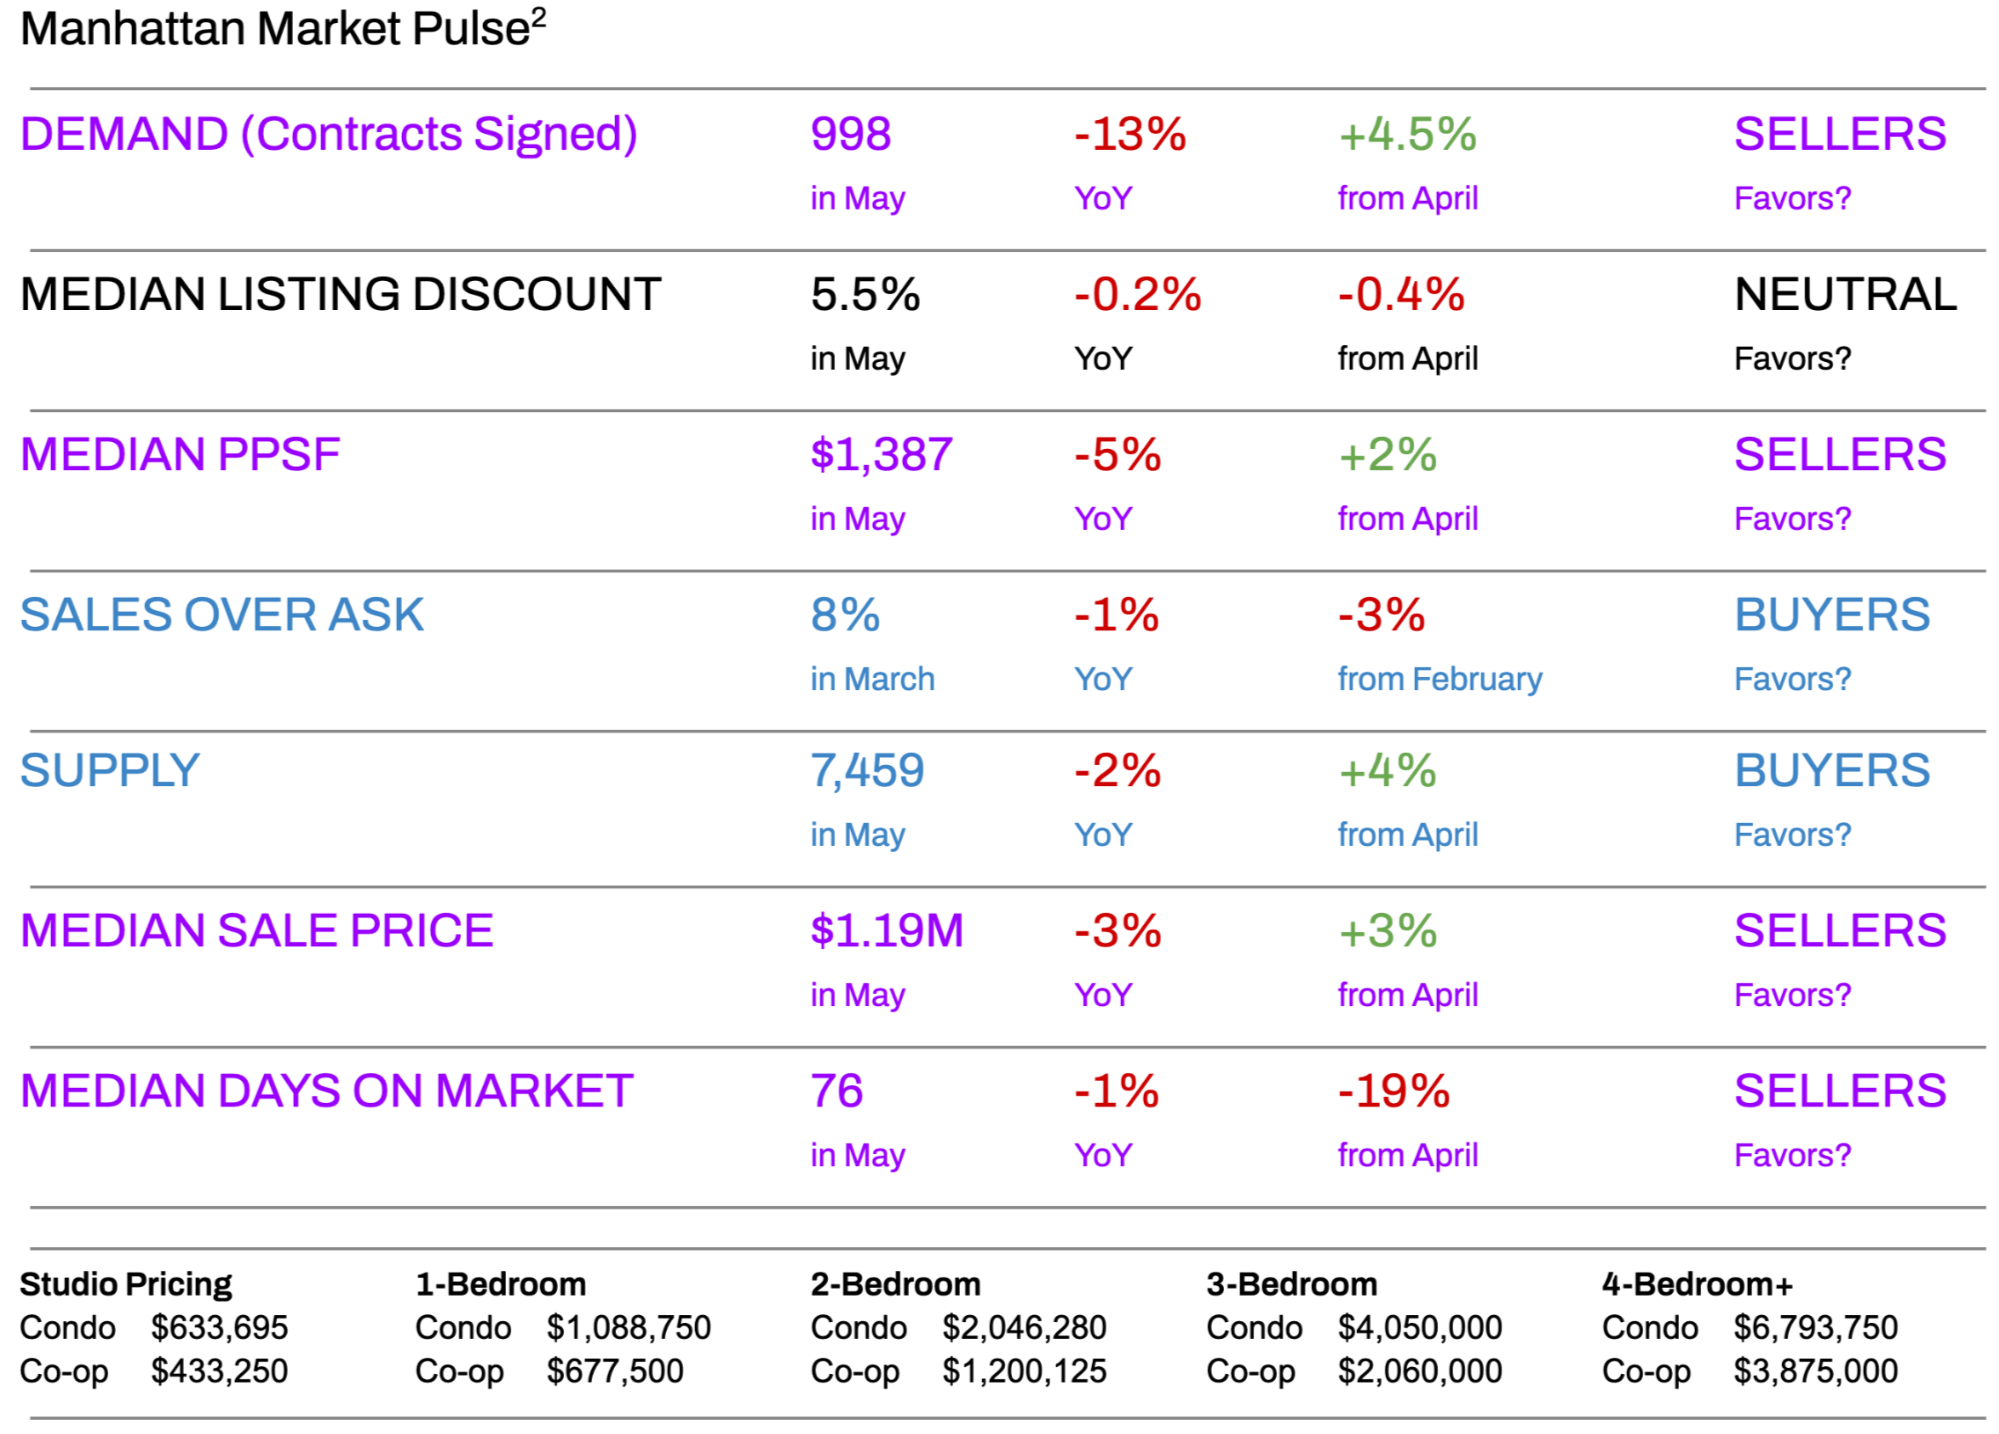
The Manhattan real estate market showed signs of improvement in May compared to April, with an acceleration in contract volume (demand) and an increase in supply. However, both demand and total supply were lower than in May of the previous year.
Contract volume increased by 4.5% month over month but declined by 13% year over year, while supply rose by 4% month over month but was 2% lower than the same time last year.
Earlier this year, demand increased at a faster rate than supply, but this trend reversed in May, with supply growing more rapidly than demand. This shift could have a cooling effect on the market, which might become more evident in the summer months.
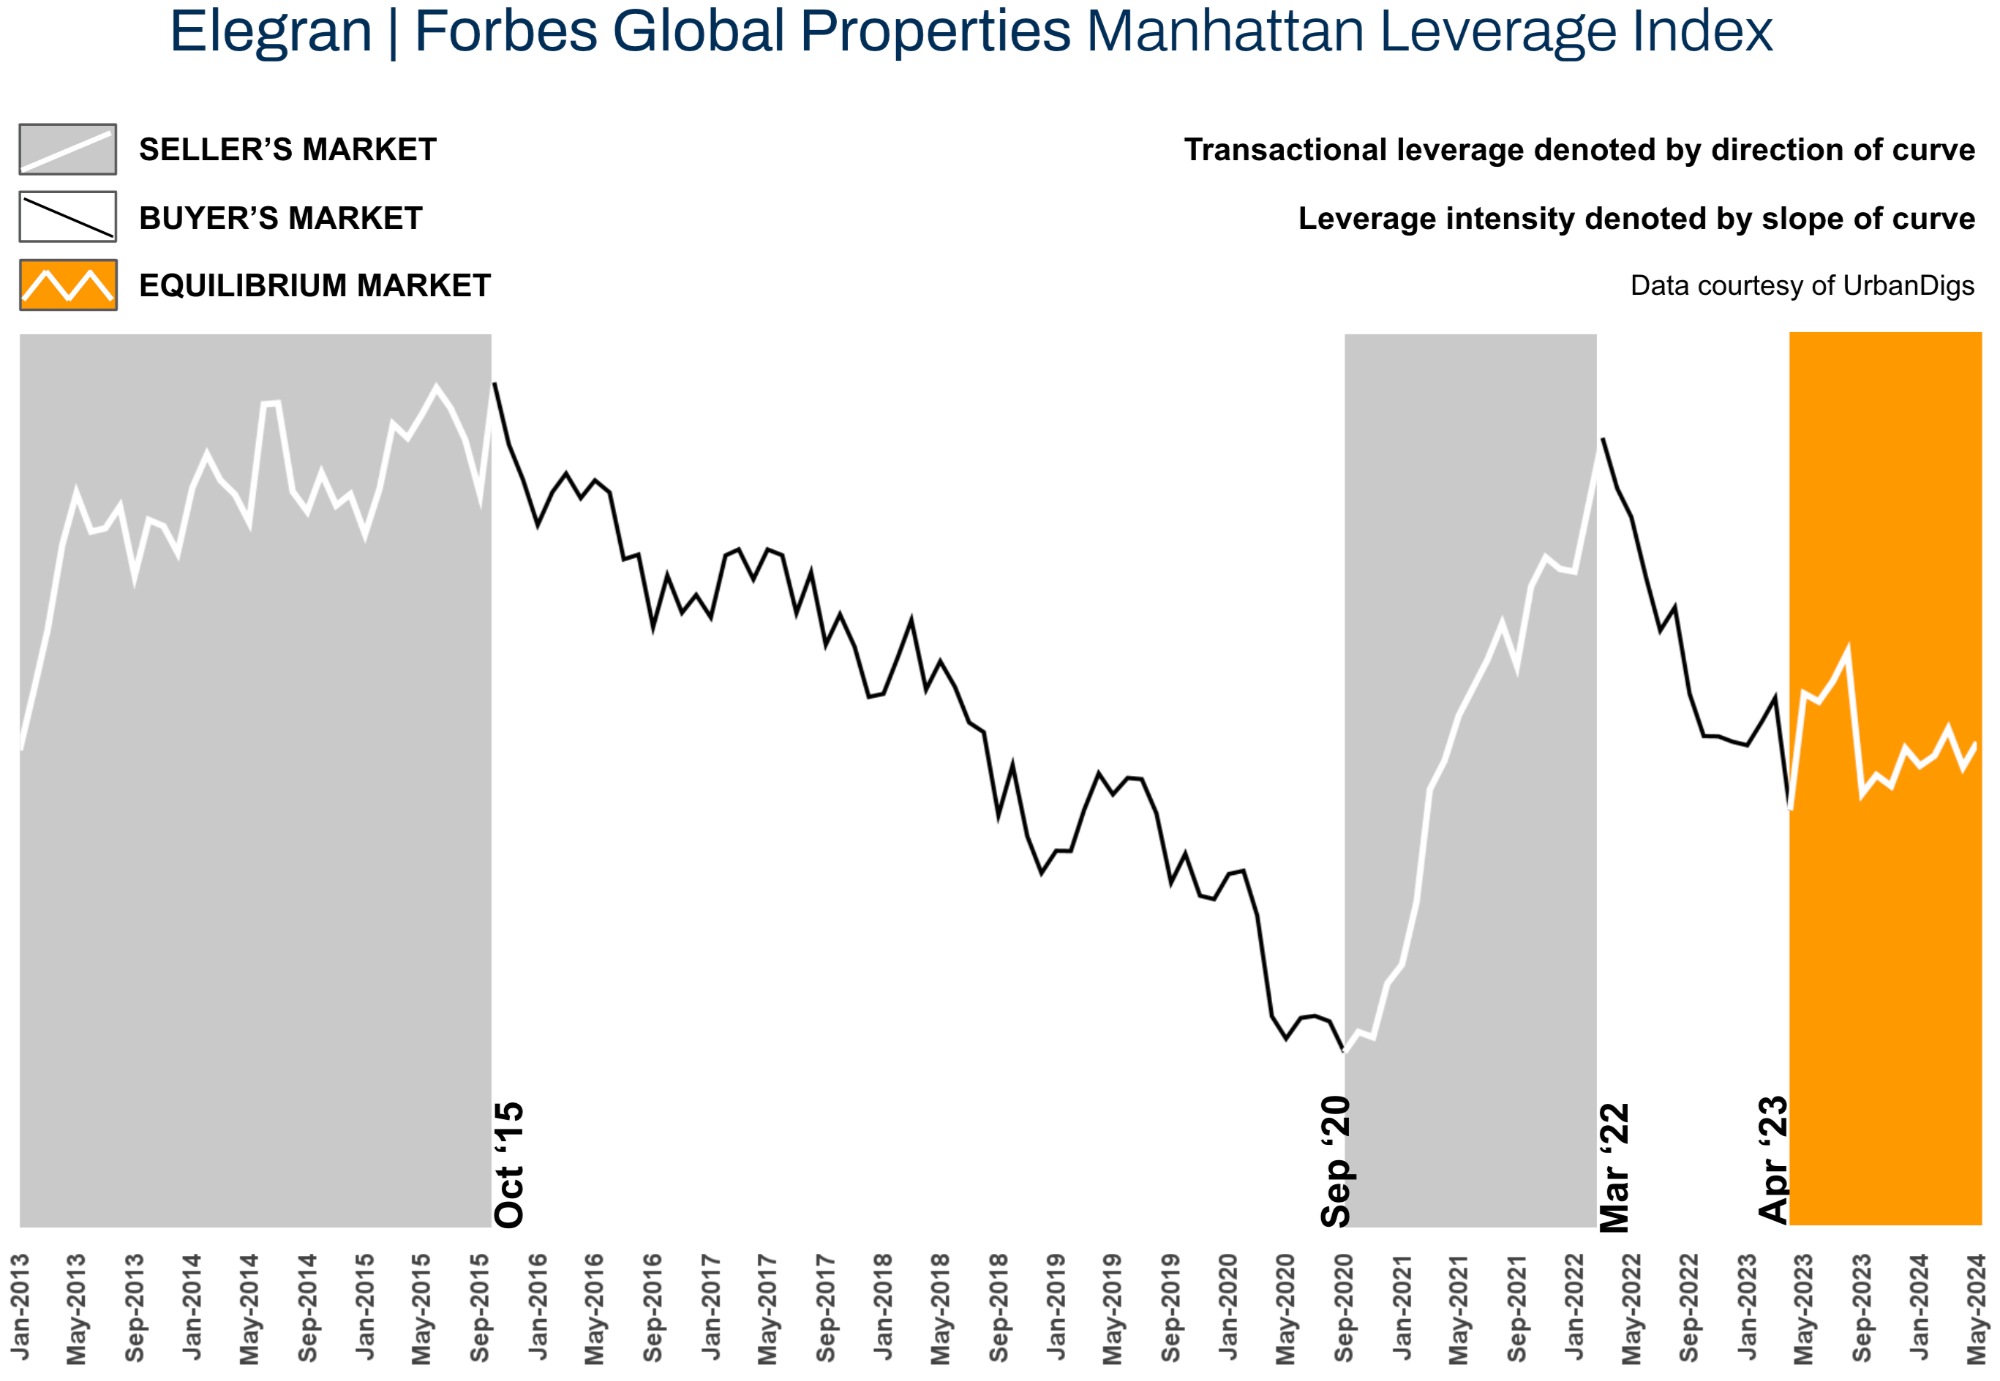
According to the Elegran | Forbes Global Properties Manhattan Leverage Index for May, the market is nearing equilibrium, with properties selling more quickly and at a higher price per square foot than last month.
Moving into the summer months, buyers may gain some advantage. Historically, contract volume declines during the summer months. Although overall supply tends to decrease—due to fewer new-to-market properties and more properties being taken off the market—remaining sellers may be more motivated. This could lead to reduced asking prices or increased negotiability, presenting potential opportunities for buyers.
SALES
– “Neutral” markets don’t exist because buyers and sellers are constantly playing tug-of-war for leverage
– At times (e.g., more than 1 year already), there’s no clear winner as buyers & sellers reach equilibrium¹
– According to the data, May was a neutral month, where neither buyers nor sellers had a significant edge, although sellers gained a very slight edge.
- Demand (measured by contracts signed) increased by 4.5% in the seller's favor.
- Supply increased by 4% in the buyer’s favor.
- Median days on the market decreased by 19% in the seller’s favor.
- Median PPSF (Price Per Square Foot) increased by 2% in the seller’s favor.
RENTALS
– April saw a 5% increase in median rental prices from March, lifting the median price to $4,200.
– The median rent for new developments continued to rise at a higher annual rate compared to existing rentals, reflecting the more luxurious nature of these new projects.³
Elegran | Forbes Global Properties Manhattan Leverage Index
The Elegran | Forbes Global Properties Manhattan Leverage Index is powered by four indicators: supply, demand, median price per square foot (PPSF), and median listing discount.
It informs us whether the current is a buyer’s or a seller’s market, i.e., which party possesses transactional leverage. Looking at the graph below, this is indicated by the direction of the curve, where:
- An increasing trend from left to right indicates a seller’s market
- A decreasing trend from left to right indicates a buyer’s market
Our indicator also informs us regarding the relative strength of that leverage, indicated by the slope of the curve, where:
- A gentle slope indicates a weak advantage by one party over the other
- A sharp slope indicates a strong advantage
But the numbers are not important. What is important is the direction and slope of the curve. For more than a year, there has been a stalemate between buyers and sellers in a relatively balanced market. The Manhattan market is currently in a state of equilibrium, with neither buyers nor sellers holding a clear upper hand. Heading into the summer, with less new-to-market supply and traditionally fewer contracts signed, will a window of opportunity arise for buyers?
Manhattan Supply
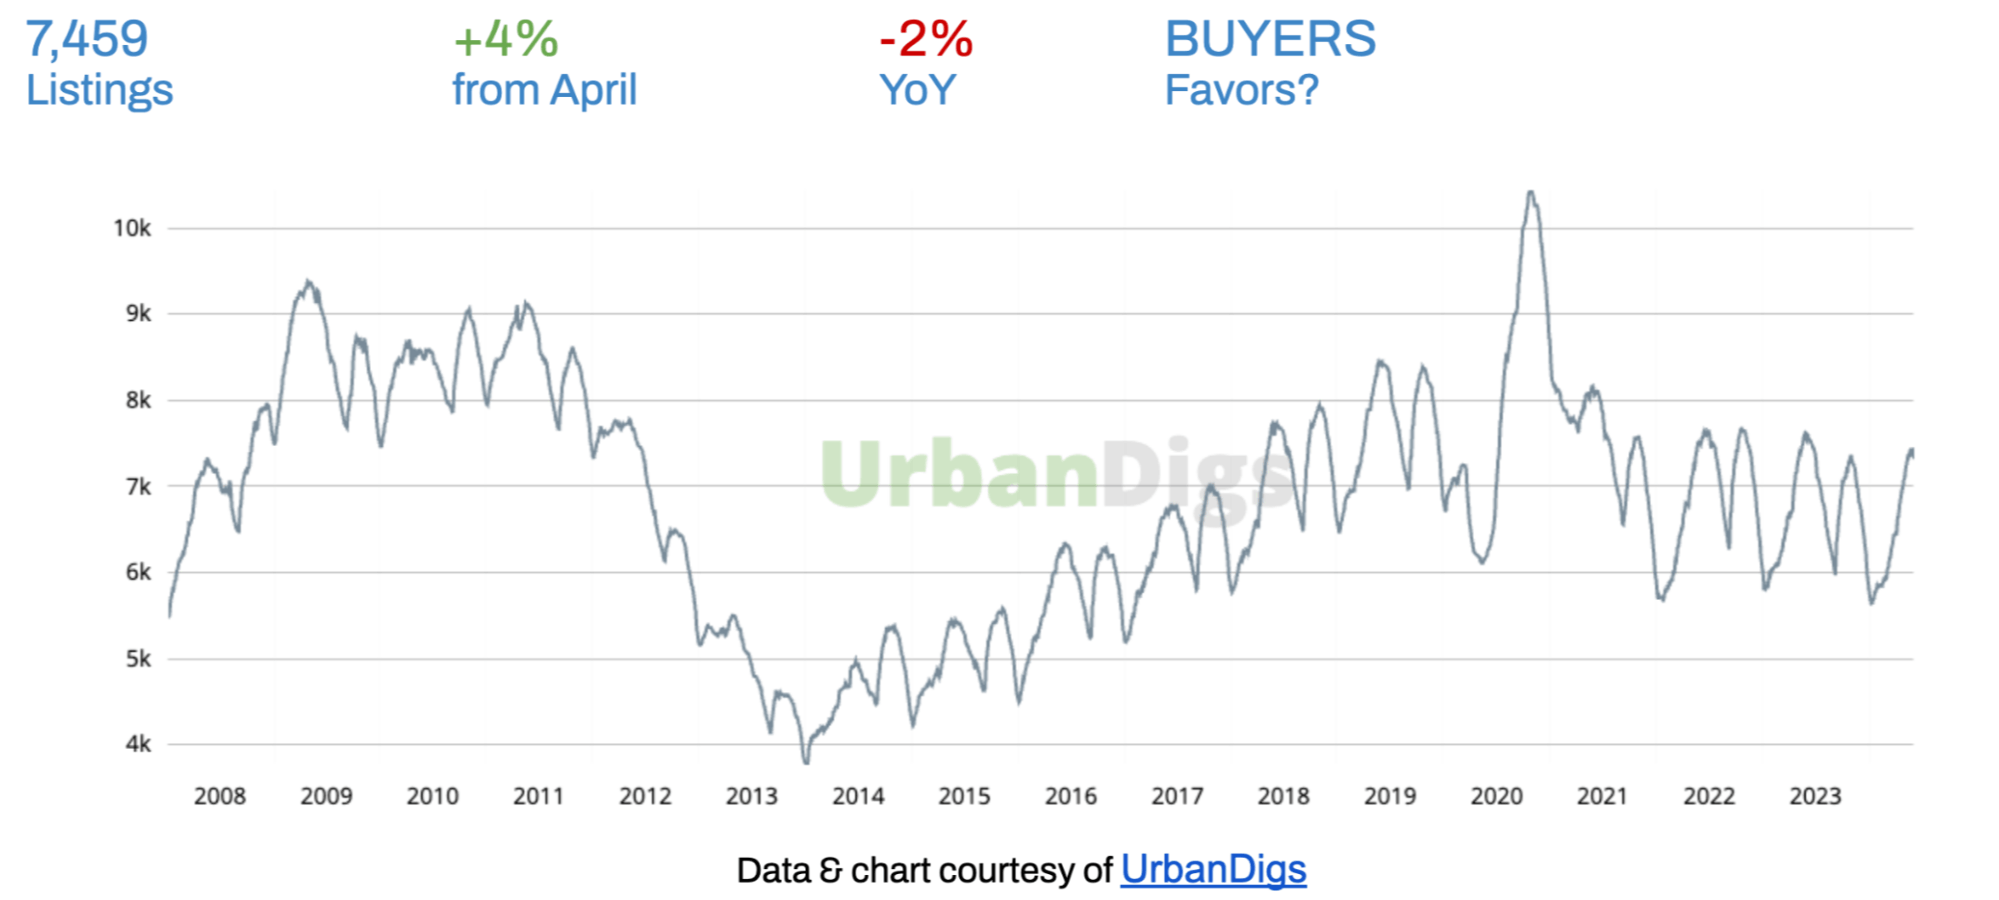
Despite the typical seasonal increase from April to May, the total supply in May was still 2% lower than last year. This lower supply helps maintain the market’s near-equilibrium, counterbalancing the decrease in contract volume.
What this means for:
- BUYERS: The month-over-month increase might offer more options in the short term.
- SELLERS: The year-over-year decrease in supply might be beneficial for sellers, as less competition can potentially lead to faster sales and possibly better pricing power.
Overall, while the short-term increase in supply provides more immediate options for buyers, the longer-term trend of decreased listings suggests a generally tighter market, which could influence future market conditions in terms of pricing and availability. Heading into the summer months expect a decrease in new-to-market supply until the fall and an increase in properties being taken off the market.
Manhattan Demand
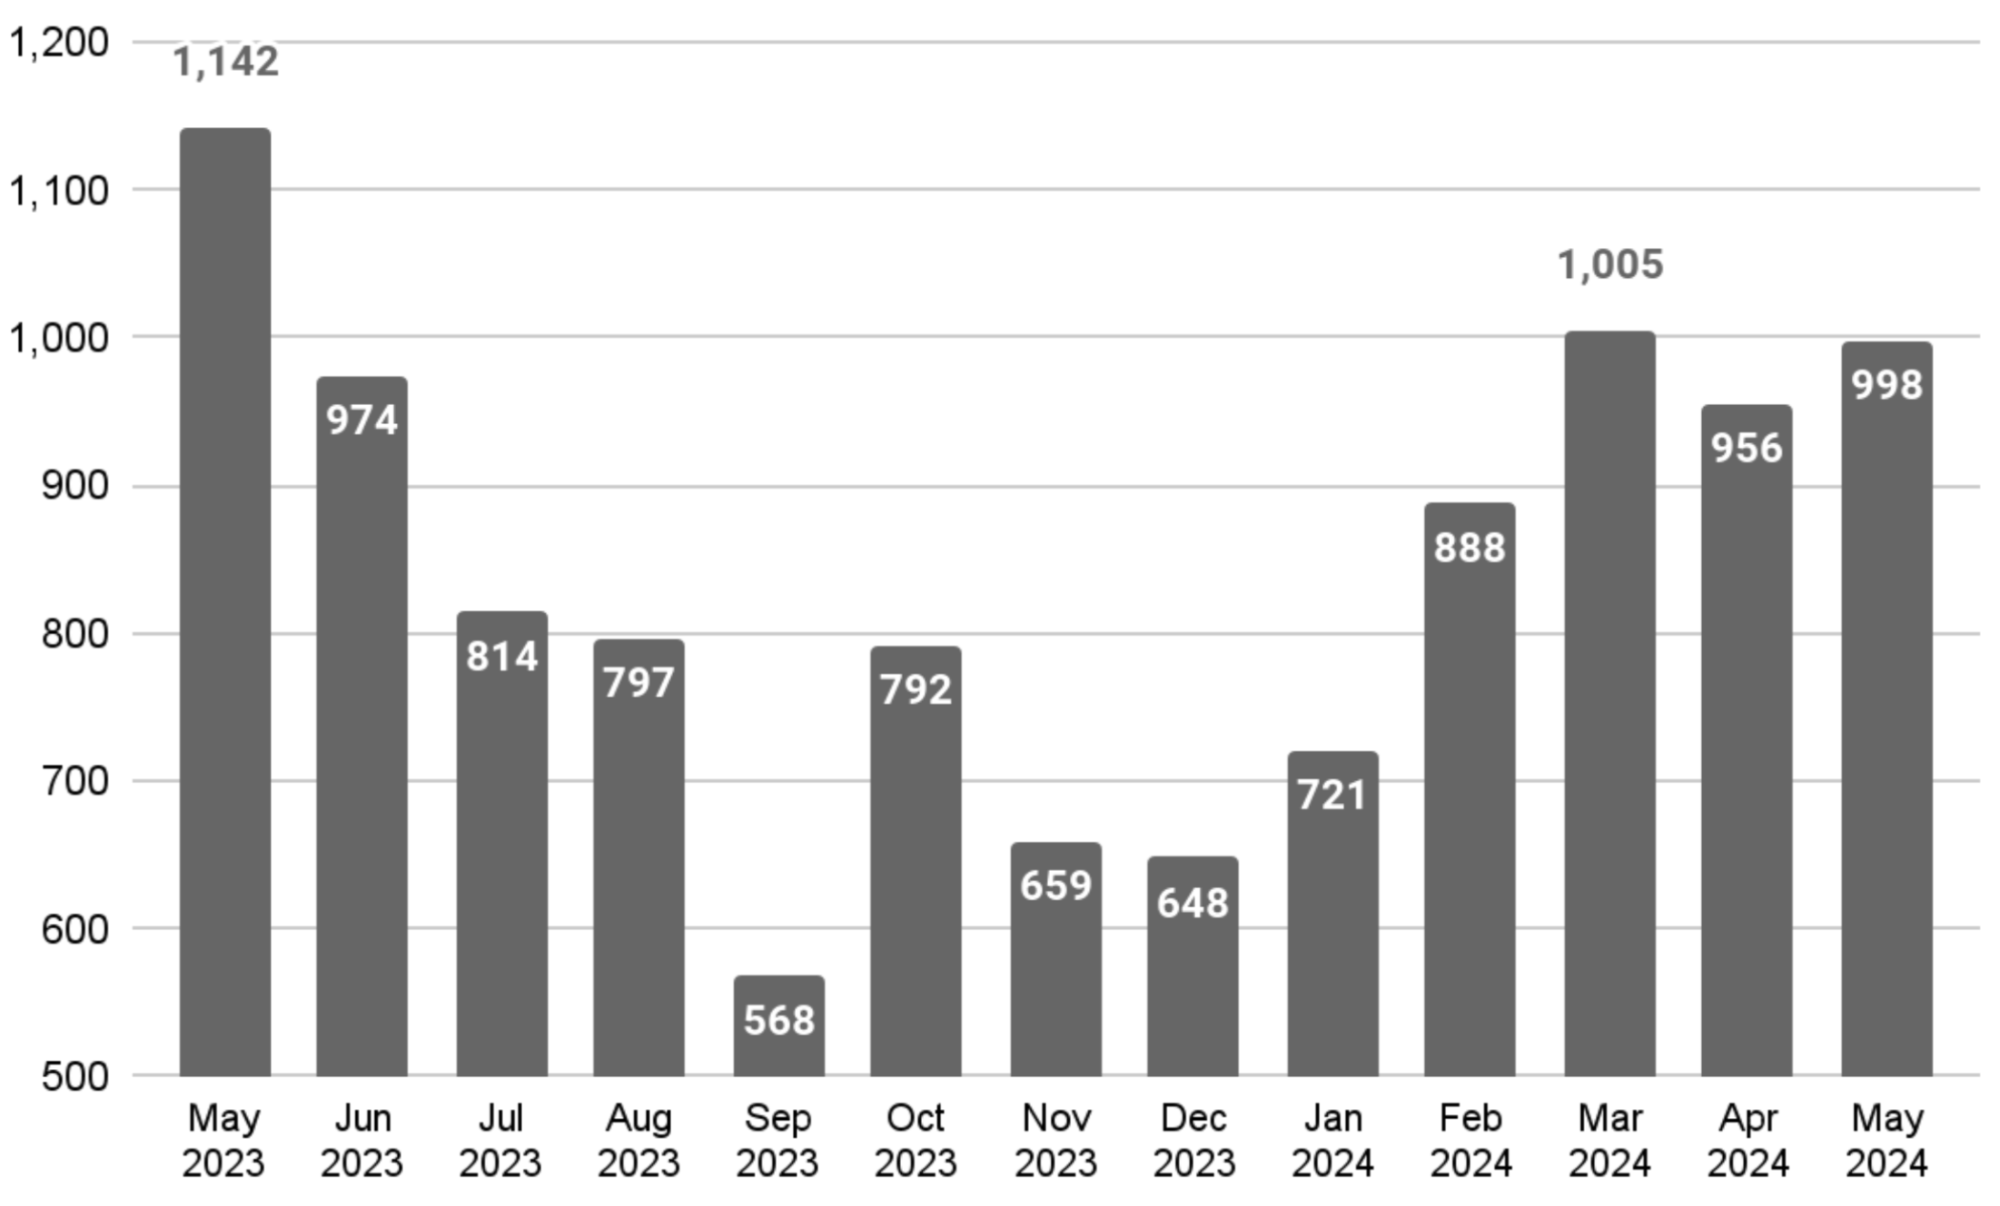
The 4.5% increase in contracts signed from April to May 2024 indicates a seasonal or short-term uptick in market activity, which is typical for the spring season when more buyers and sellers enter the market. However, the 13% decrease in contracts signed compared to May 2023 suggests an annual slowdown influenced by higher interest rates, inflation, and the upcoming election.
What this means for:
- BUYERS: Despite the annual decrease, the month-over-month increase suggests heightened competition among buyers. Be prepared to act quickly if you find a desirable property.
- SELLERS: You may need to be more competitive with pricing due to the overall annual decrease in demand. However, the month-over-month increase indicates slightly more activity and interest than in April, providing a potentially better selling environment.
The mixed signals—a decrease year-over-year but an increase month-over-month—indicate a nuanced market. While there is a general cooling compared to last year, the seasonal trend shows a rebound in activity, typical for the spring season.
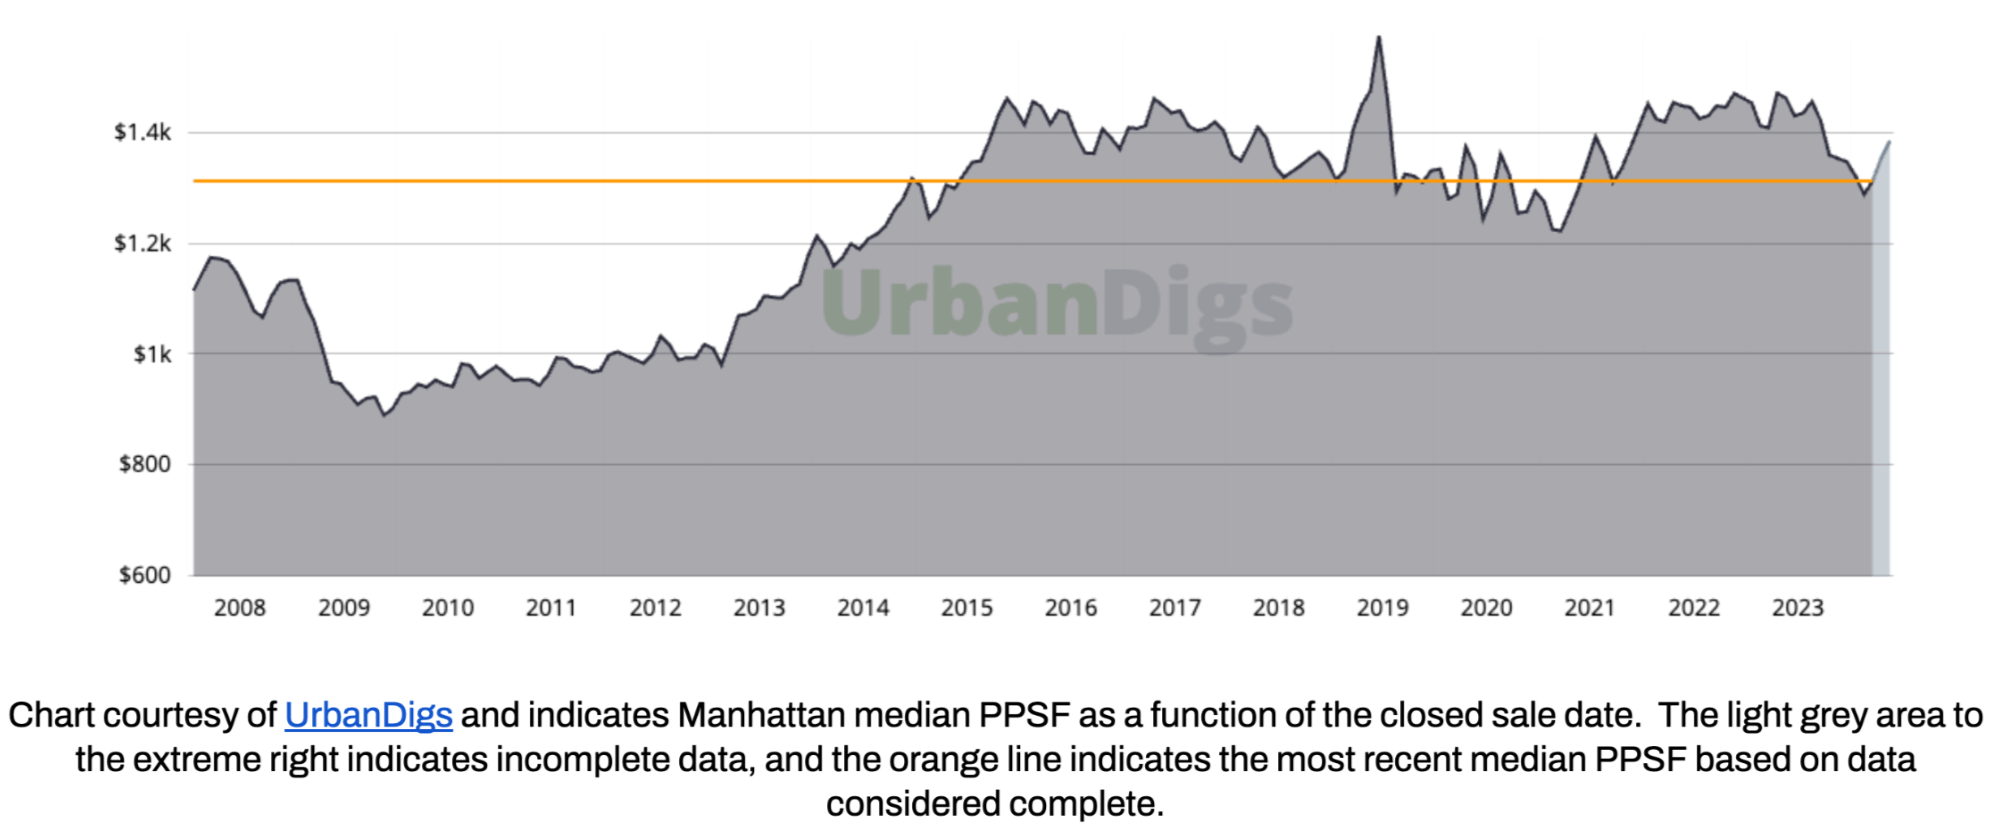
Manhattan Median PPSF
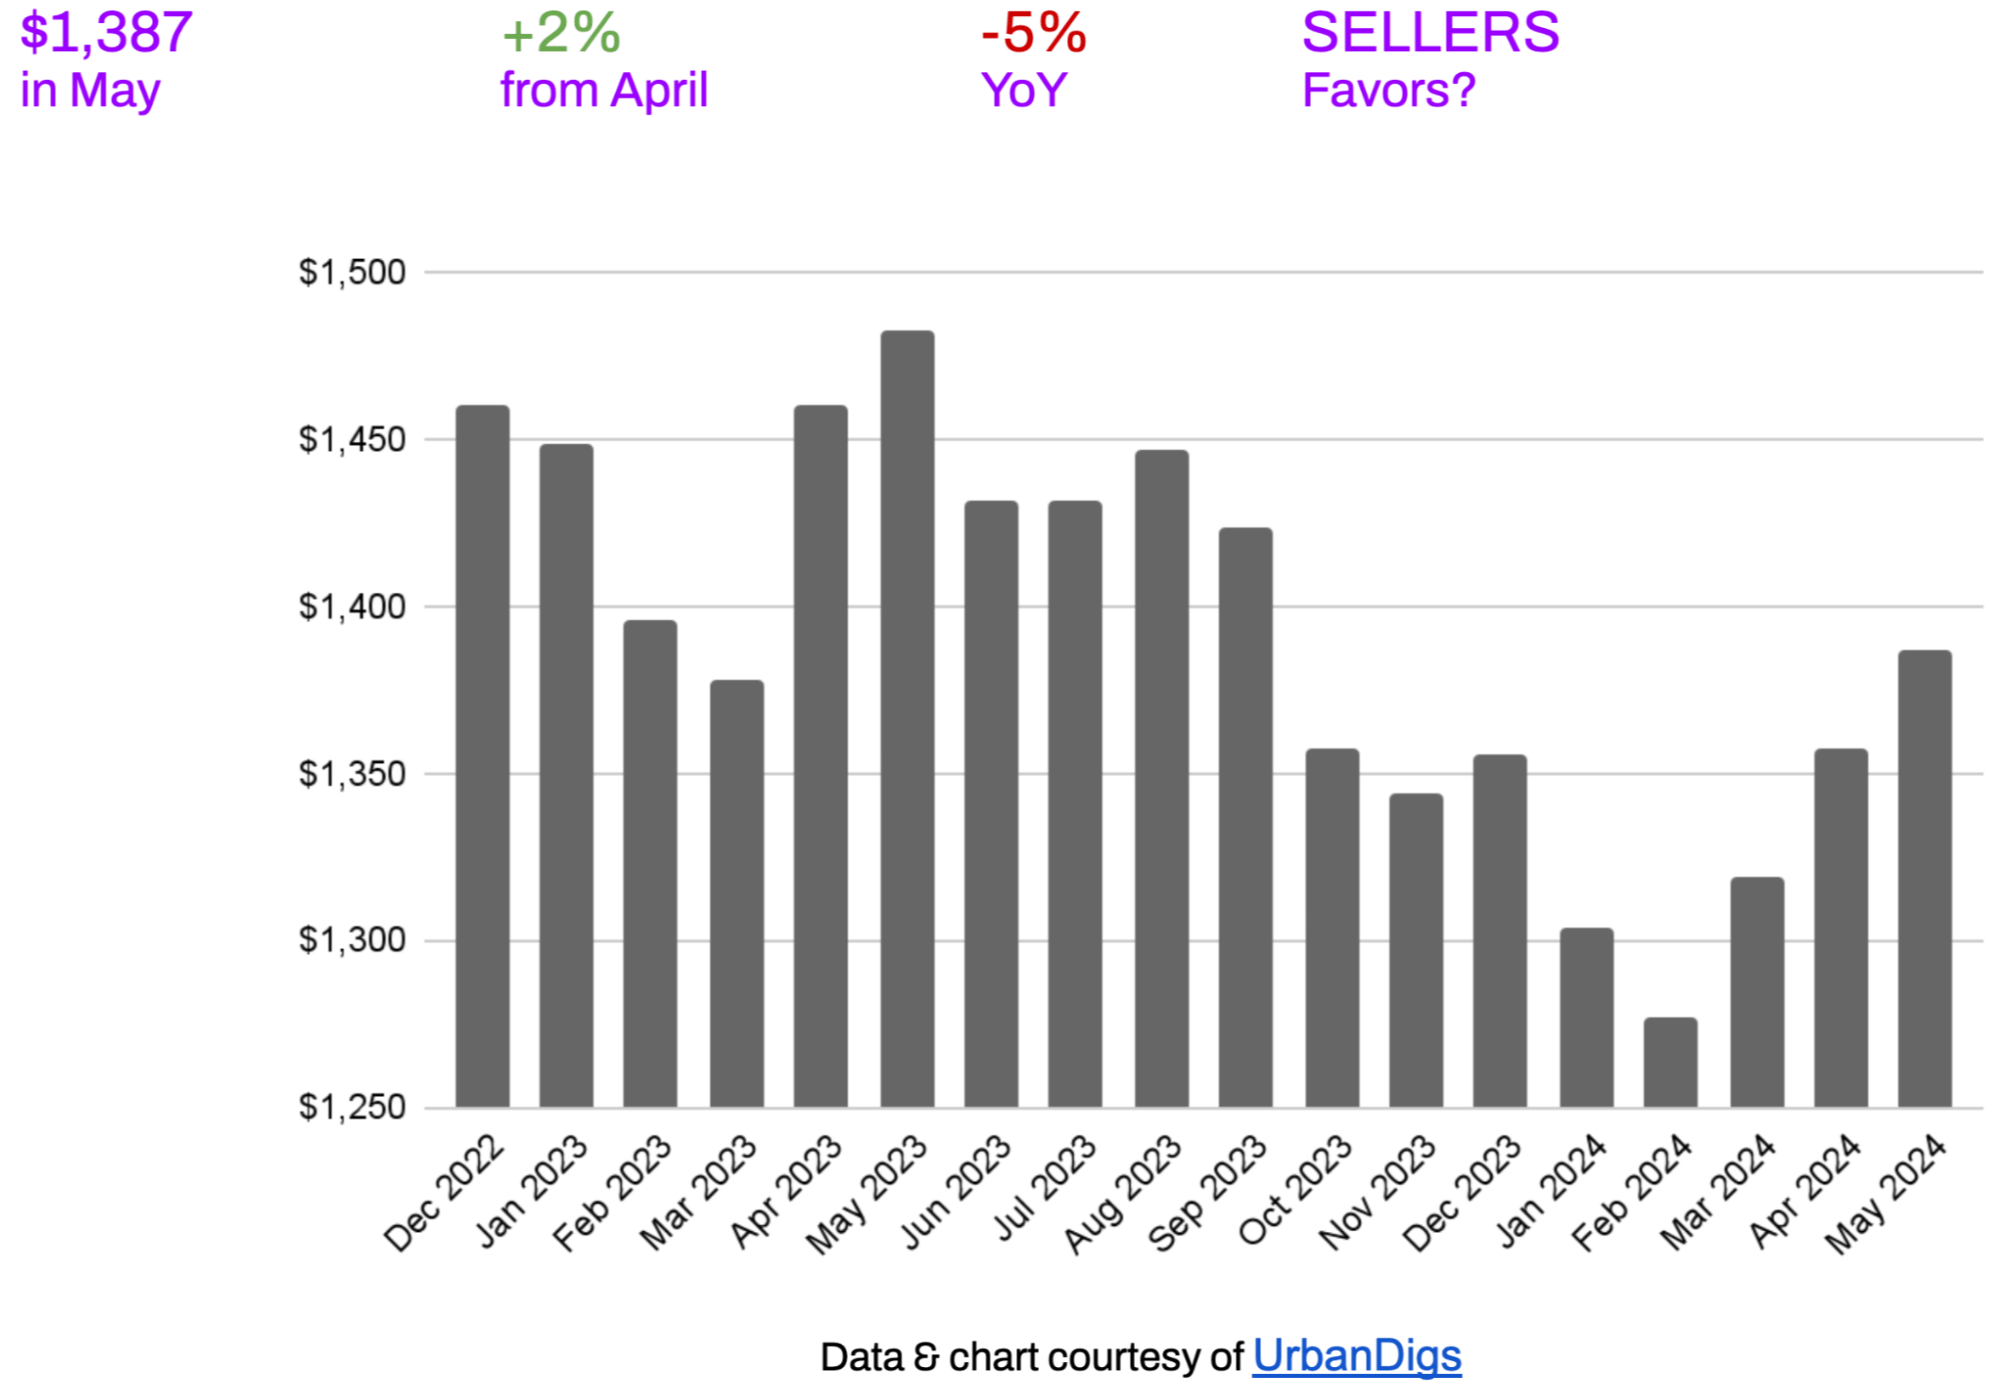
The median price per square foot (PPSF) increased by 2% from April 2024 and decreased by 5% compared to May 2023. Both buyers and sellers should continue to monitor the market for any new trends or changes in economic conditions that might affect real estate prices in Manhattan.
What this means for:
- BUYERS: Understanding these trends is crucial for timing transactions. The recent monthly uptick might prompt sellers to capitalize on higher prices, while buyers can leverage the annual decrease to negotiate better deals.
- SELLERS: The increase in PPSF from April is encouraging, but this trend may not persist in the short term. The year-over-year decline highlights the need for realistic pricing, as overpricing may result in properties lingering on the market.
While the short-term increase in PPSF is a positive sign for sellers, the longer-term decrease suggests a cautious approach is warranted. Buyers can find opportunities in the current market and potentially benefit through the summer months.
Manhattan Median Listing Discount
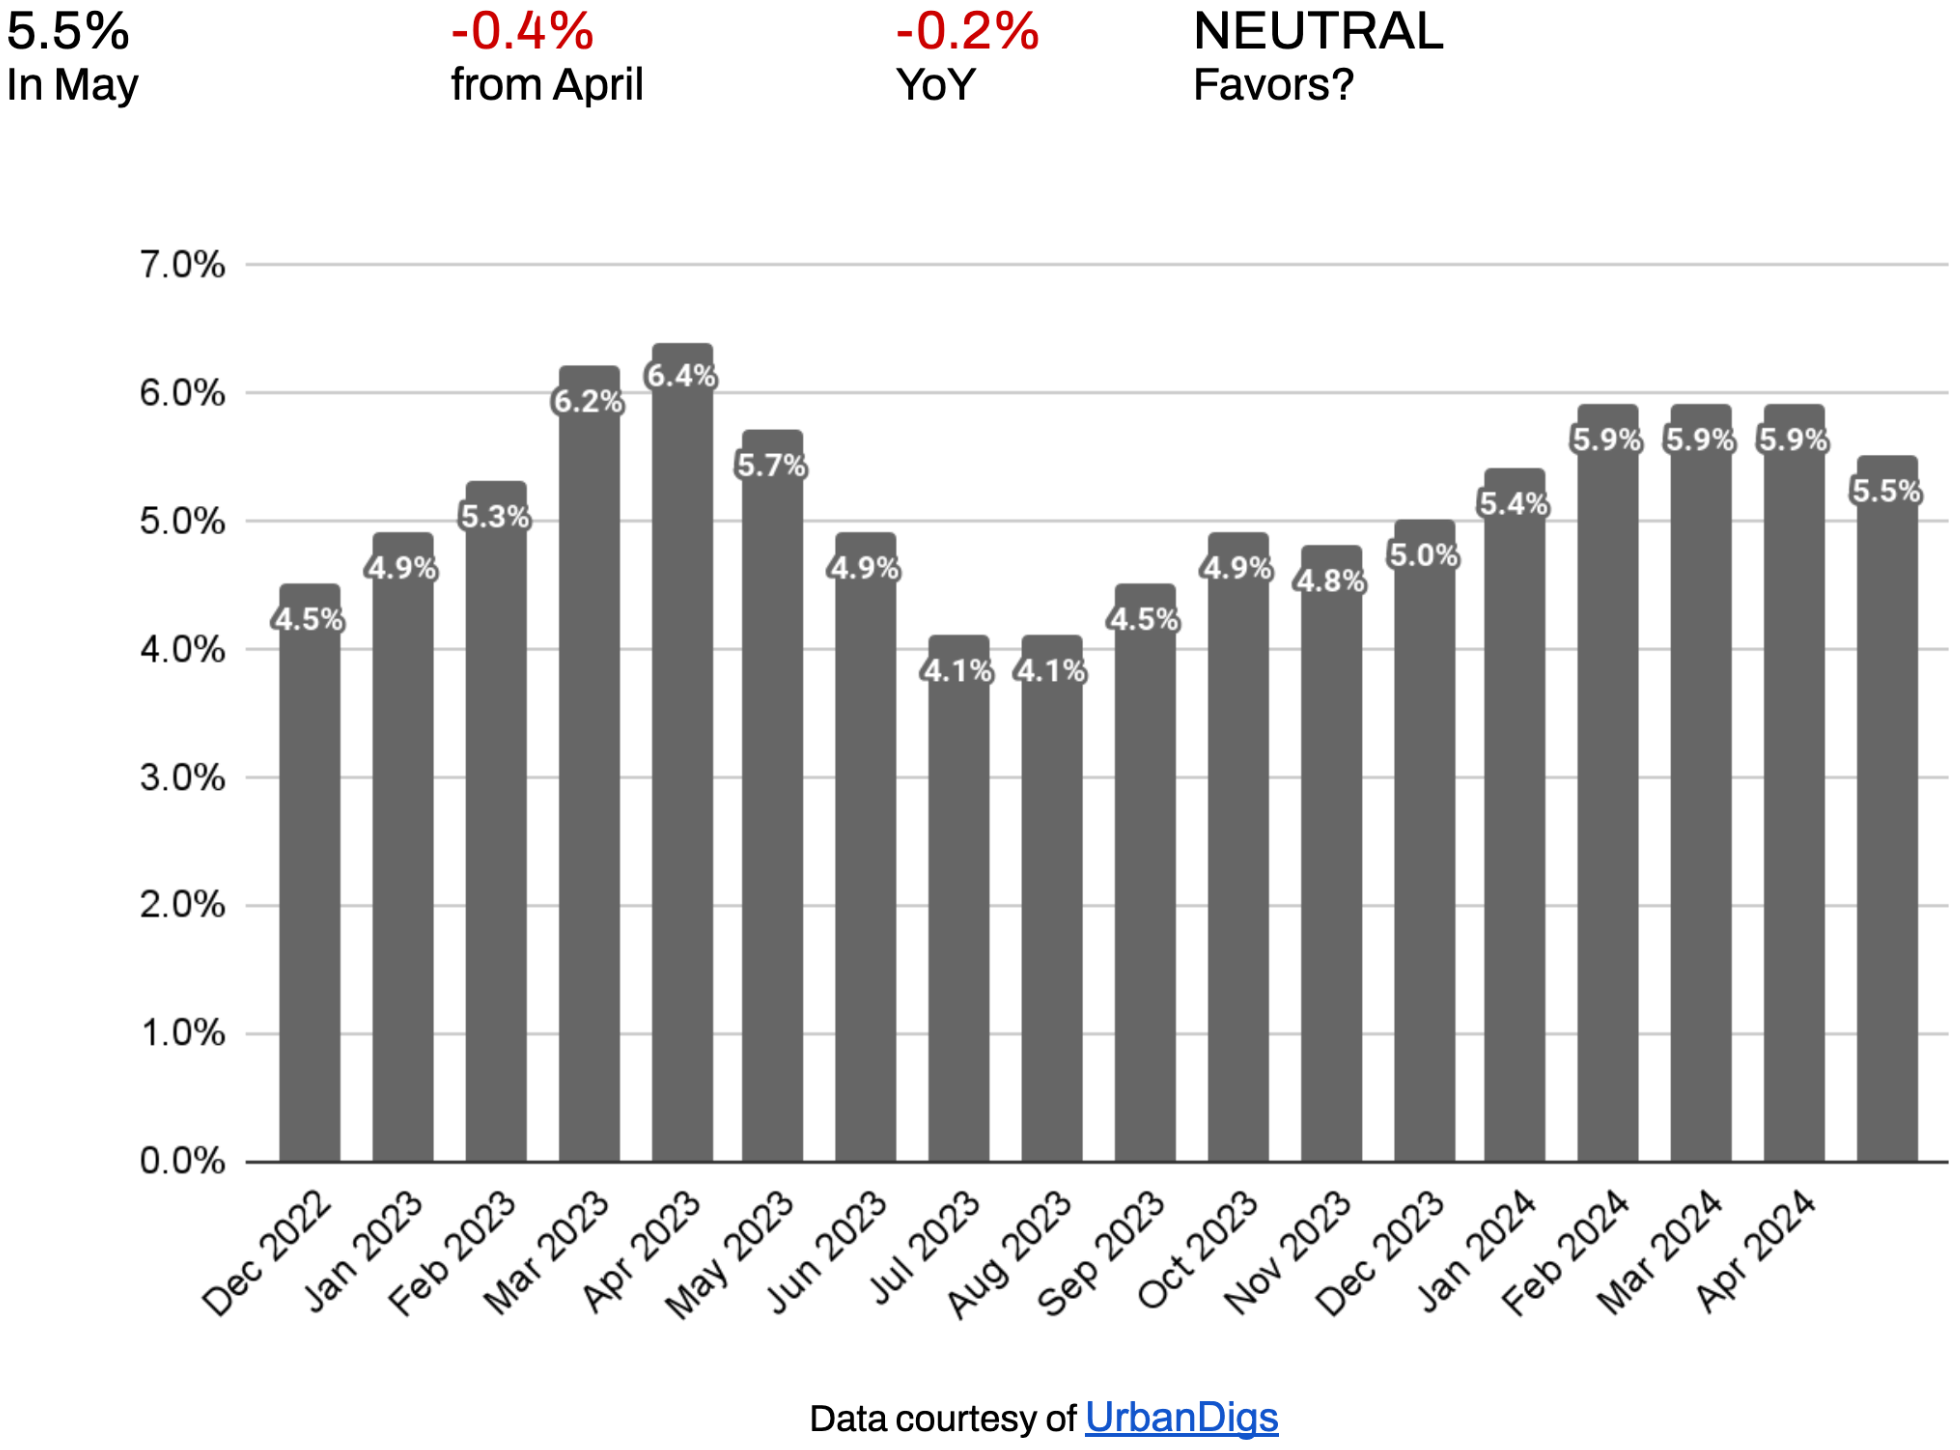
The decreasing median listing discount in Manhattan indicates a shift toward a more balanced market, potentially favoring sellers slightly more than in recent months. This trend reflects contracts signed in late winter and early spring when the market was more competitive due to supply and demand dynamics.
What this means for:
- BUYERS: The trend of decreasing discounts means buyers might have less room for negotiation than in previous periods. As discounts decrease, the opportunity to secure a better deal might diminish, urging buyers to act more quickly.
- SELLERS: The decreasing median listing discount points to a potentially stabilizing market, with improving conditions for sellers.
It remains to be seen if the recent decline in listing discounts continues into the summer months or if the trend reverses.
Rental Remarks
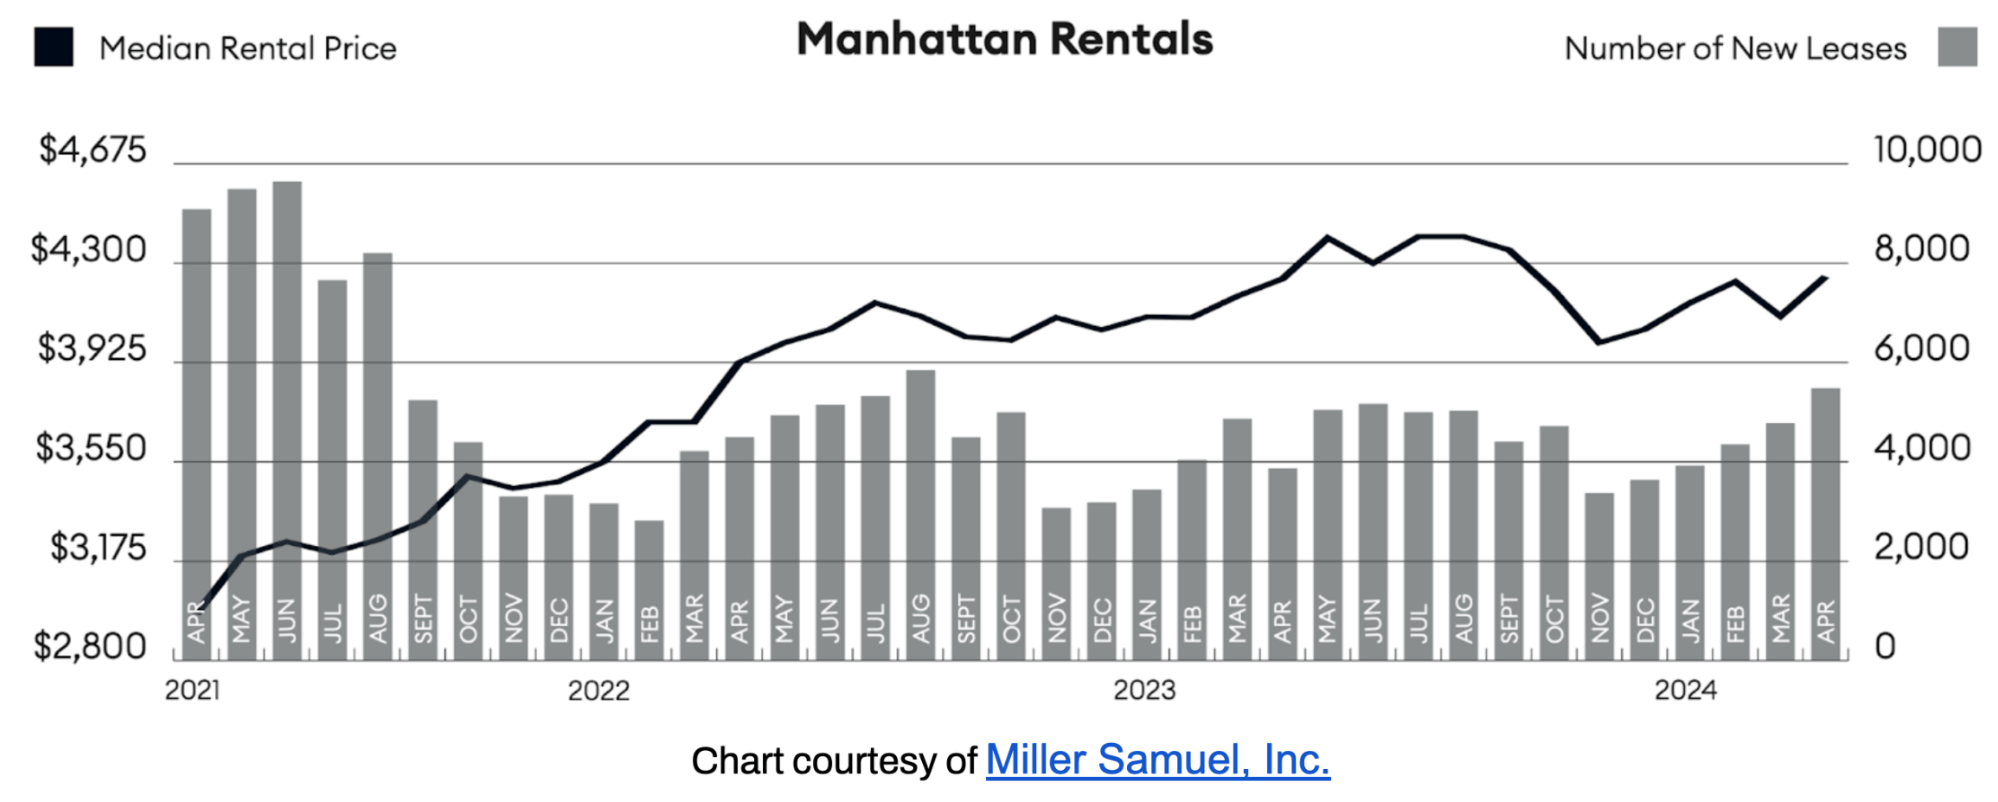
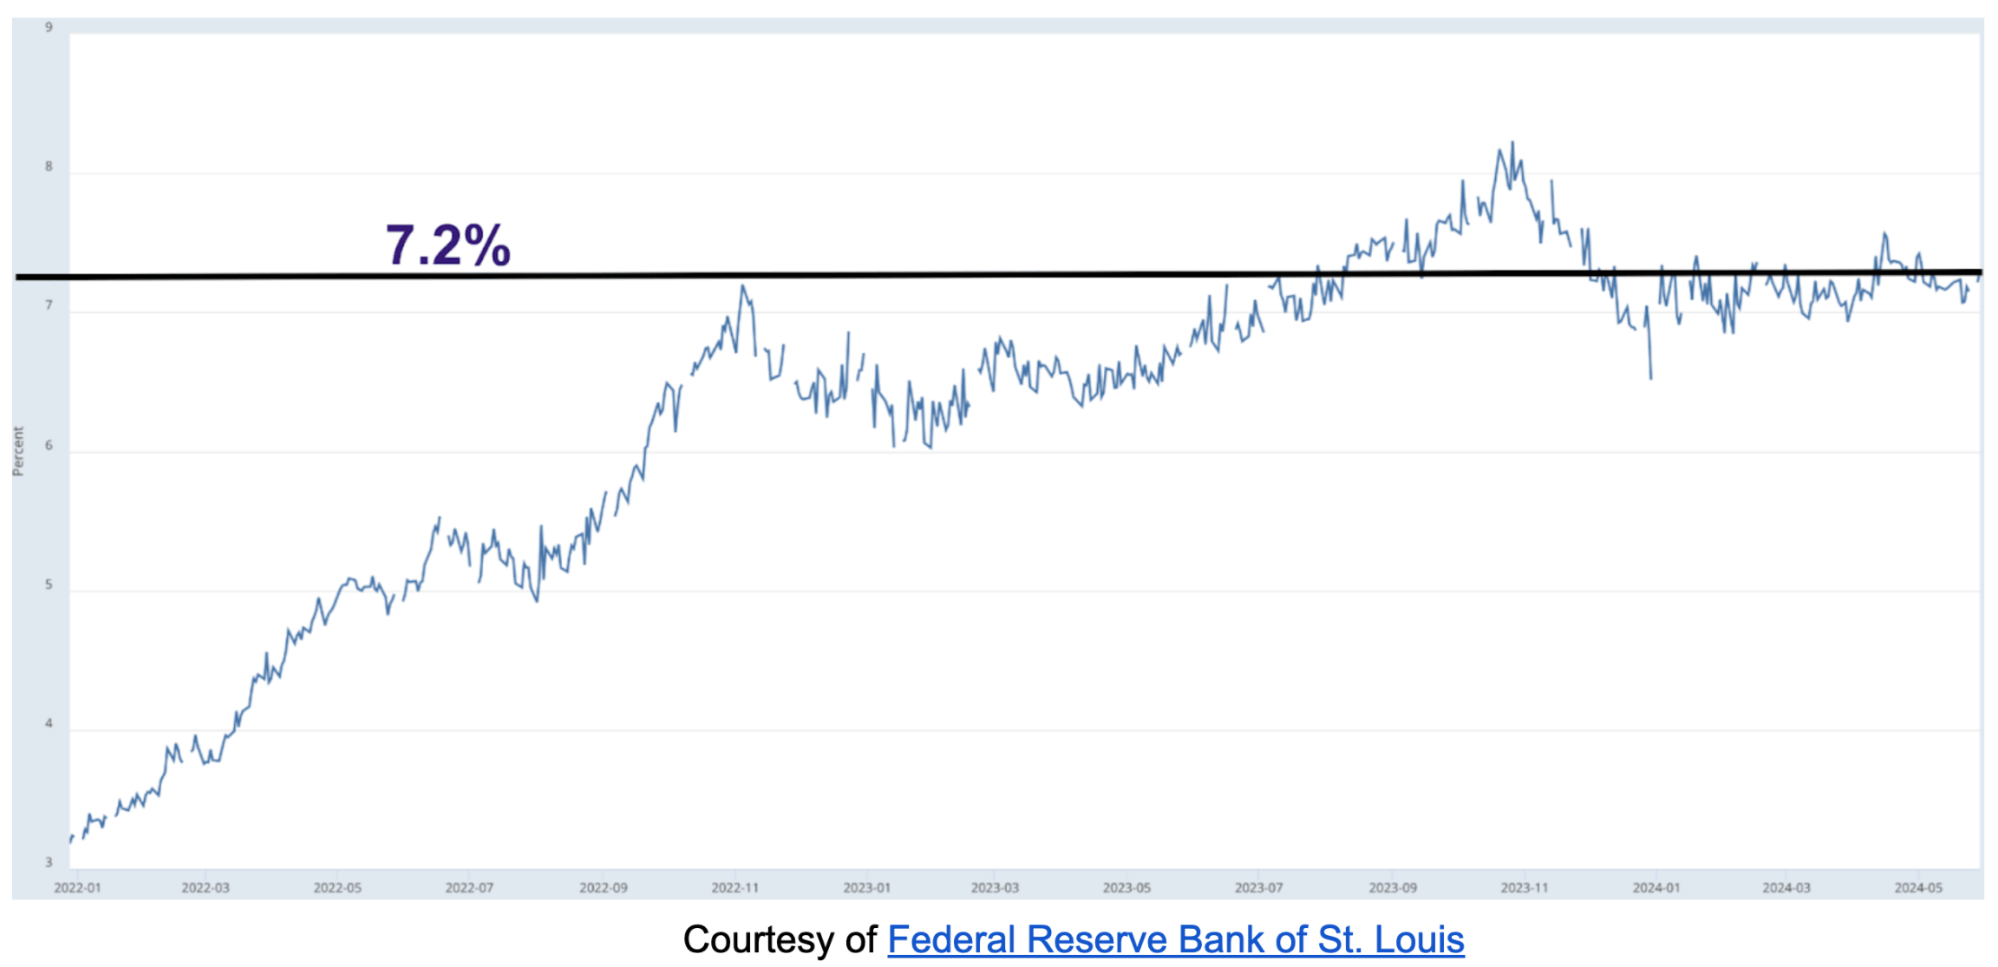
April saw a 5% increase in median rental prices from March, lifting the median price up to $4,200. Median rent for new developments continued to rise at a higher annual rate than existing rentals. The 30-Year Fixed Rate JUMBO Mortgage Index is trending at 7.2%⁴, and the average JUMBO APR is 7.1%⁵. So, it’s a “catch-22” for renters, as the rent versus buy scale may feel equally punitive on both sides. Rents are expected to continue their upward trend through the busy summer months.
Investor Insights
The total return is driven by net rental income and capital appreciation. For all-cash investors, Manhattan cap rates are currently 2.7 - 3.2%. Unfortunately, there is no net income potential for those investors using a large percentage of leverage, with the average JUMBO mortgage APR at 7.1%. Timing and a strong USD may afford foreign investors, depending on their native currency, the opportunity to realize significant capital gains upon selling their assets.
References
1. According to the Elegran | Forbes Global Properties Brooklyn Leverage Index
2. Data courtesy of UrbanDigs
3. Data courtesy of Miller Samuel, Inc.
4. Data courtesy of Federal Reserve Bank of St. Louis
5. JUMBO mortgage rate APR data courtesy of Bank of America, Chase, and Wells Fargo
If you would like to chat about the most recent market activity, feel free to contact us at info@elegran.com or connect with one of our Advisors.
About Us
Welcome to Elegran | Forbes Global Properties, where our mission is to revolutionize the world of real estate. Founded in 2008 by Michael Rossi, our journey began with an unwavering drive for motivation, innovation, and a genuine care for our clients.
As an independently owned brokerage, we pride ourselves on our elite team of "advisors," offering a personalized touch that goes above and beyond the traditional real estate experience. Armed with robust data insights, we empower our clients to make informed decisions that lead to success.
Distinguished as the exclusive member of the invitation-only Forbes Global Properties network in NYC, Elegran proudly stands at the forefront of excellence. This exclusive partnership broadens our horizons, enabling us to connect buyers, sellers, and investors with extraordinary luxury properties not only in New York City but across the globe.
Our passion lies in turning your real estate dreams into reality, and we are committed to providing exceptional service at every step of the journey.
Are you ready to experience the Elegran difference? Dive into the possibilities at www.elegran.com and embark on an unforgettable real estate adventure with us.
Categories
Recent Posts


Stay in the Know!
Sign up to receive our monthly newsletter
GET MORE INFORMATION