
Elegran Brooklyn Market Update: May 2025

Overall Brooklyn Market Update: MAY 2025
Still Active, Slightly Softer: Brooklyn Enters a More Measured Phase
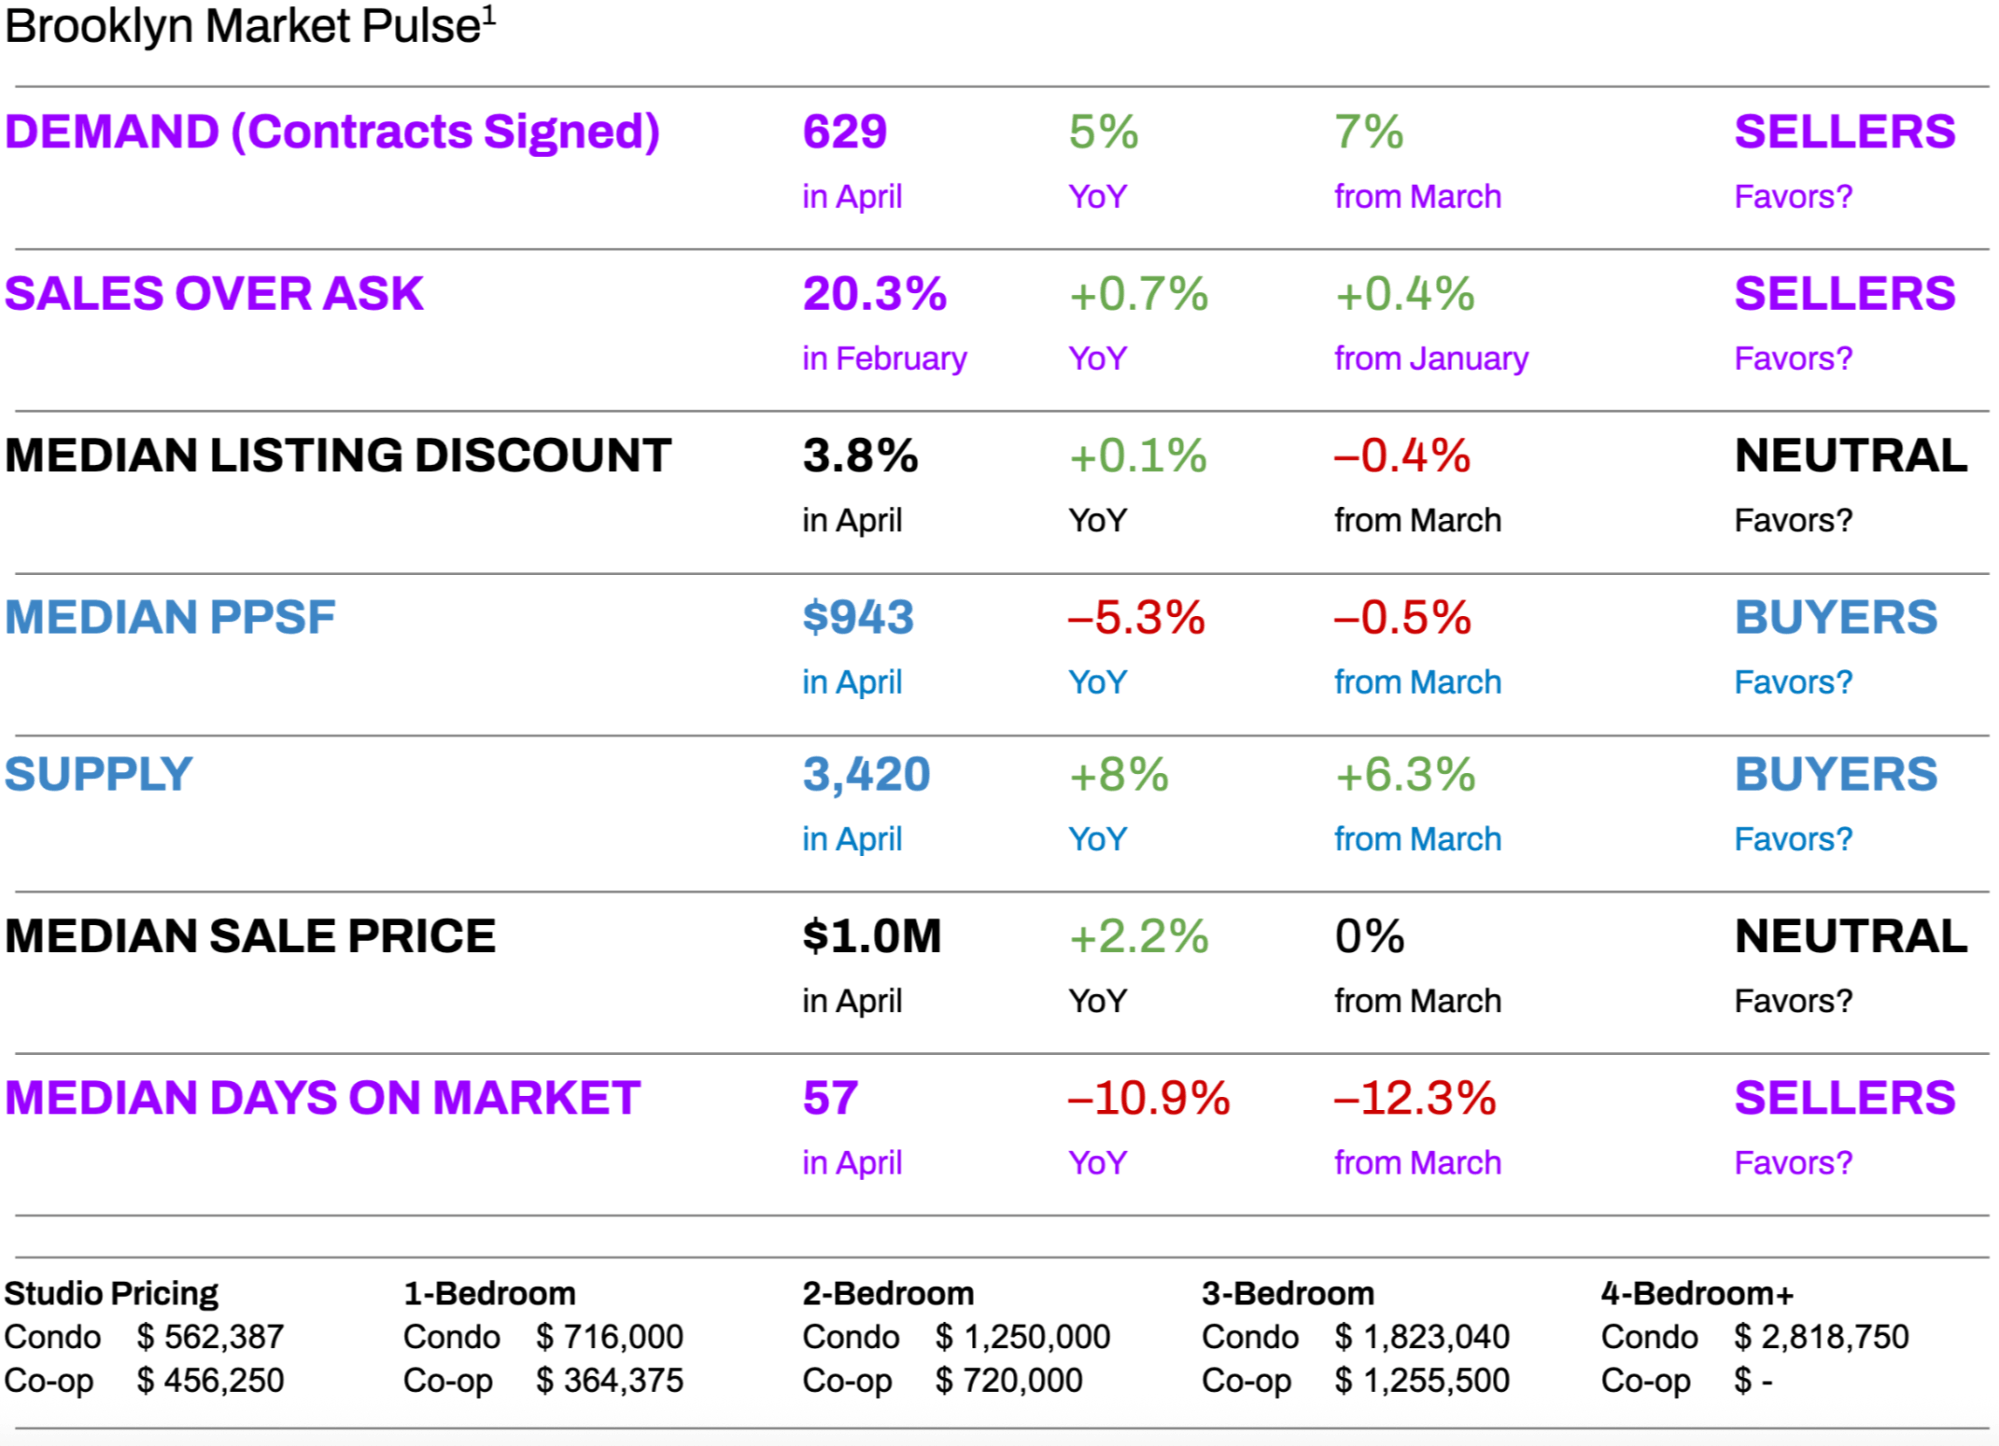
Brooklyn’s housing market continues to exhibit strength this spring, though it’s beginning to show signs of deceleration. Contract activity remains seasonally healthy, with 629 contracts signed in April—a 7% month-over-month and 5% year-over-year increase. But while demand is holding firm, the pace is less feverish than in recent years. Elevated interest rates, rising prices, and broader macroeconomic uncertainty are taking a slight bite out of buyer urgency, even as Brooklyn remains tighter on inventory than Manhattan.
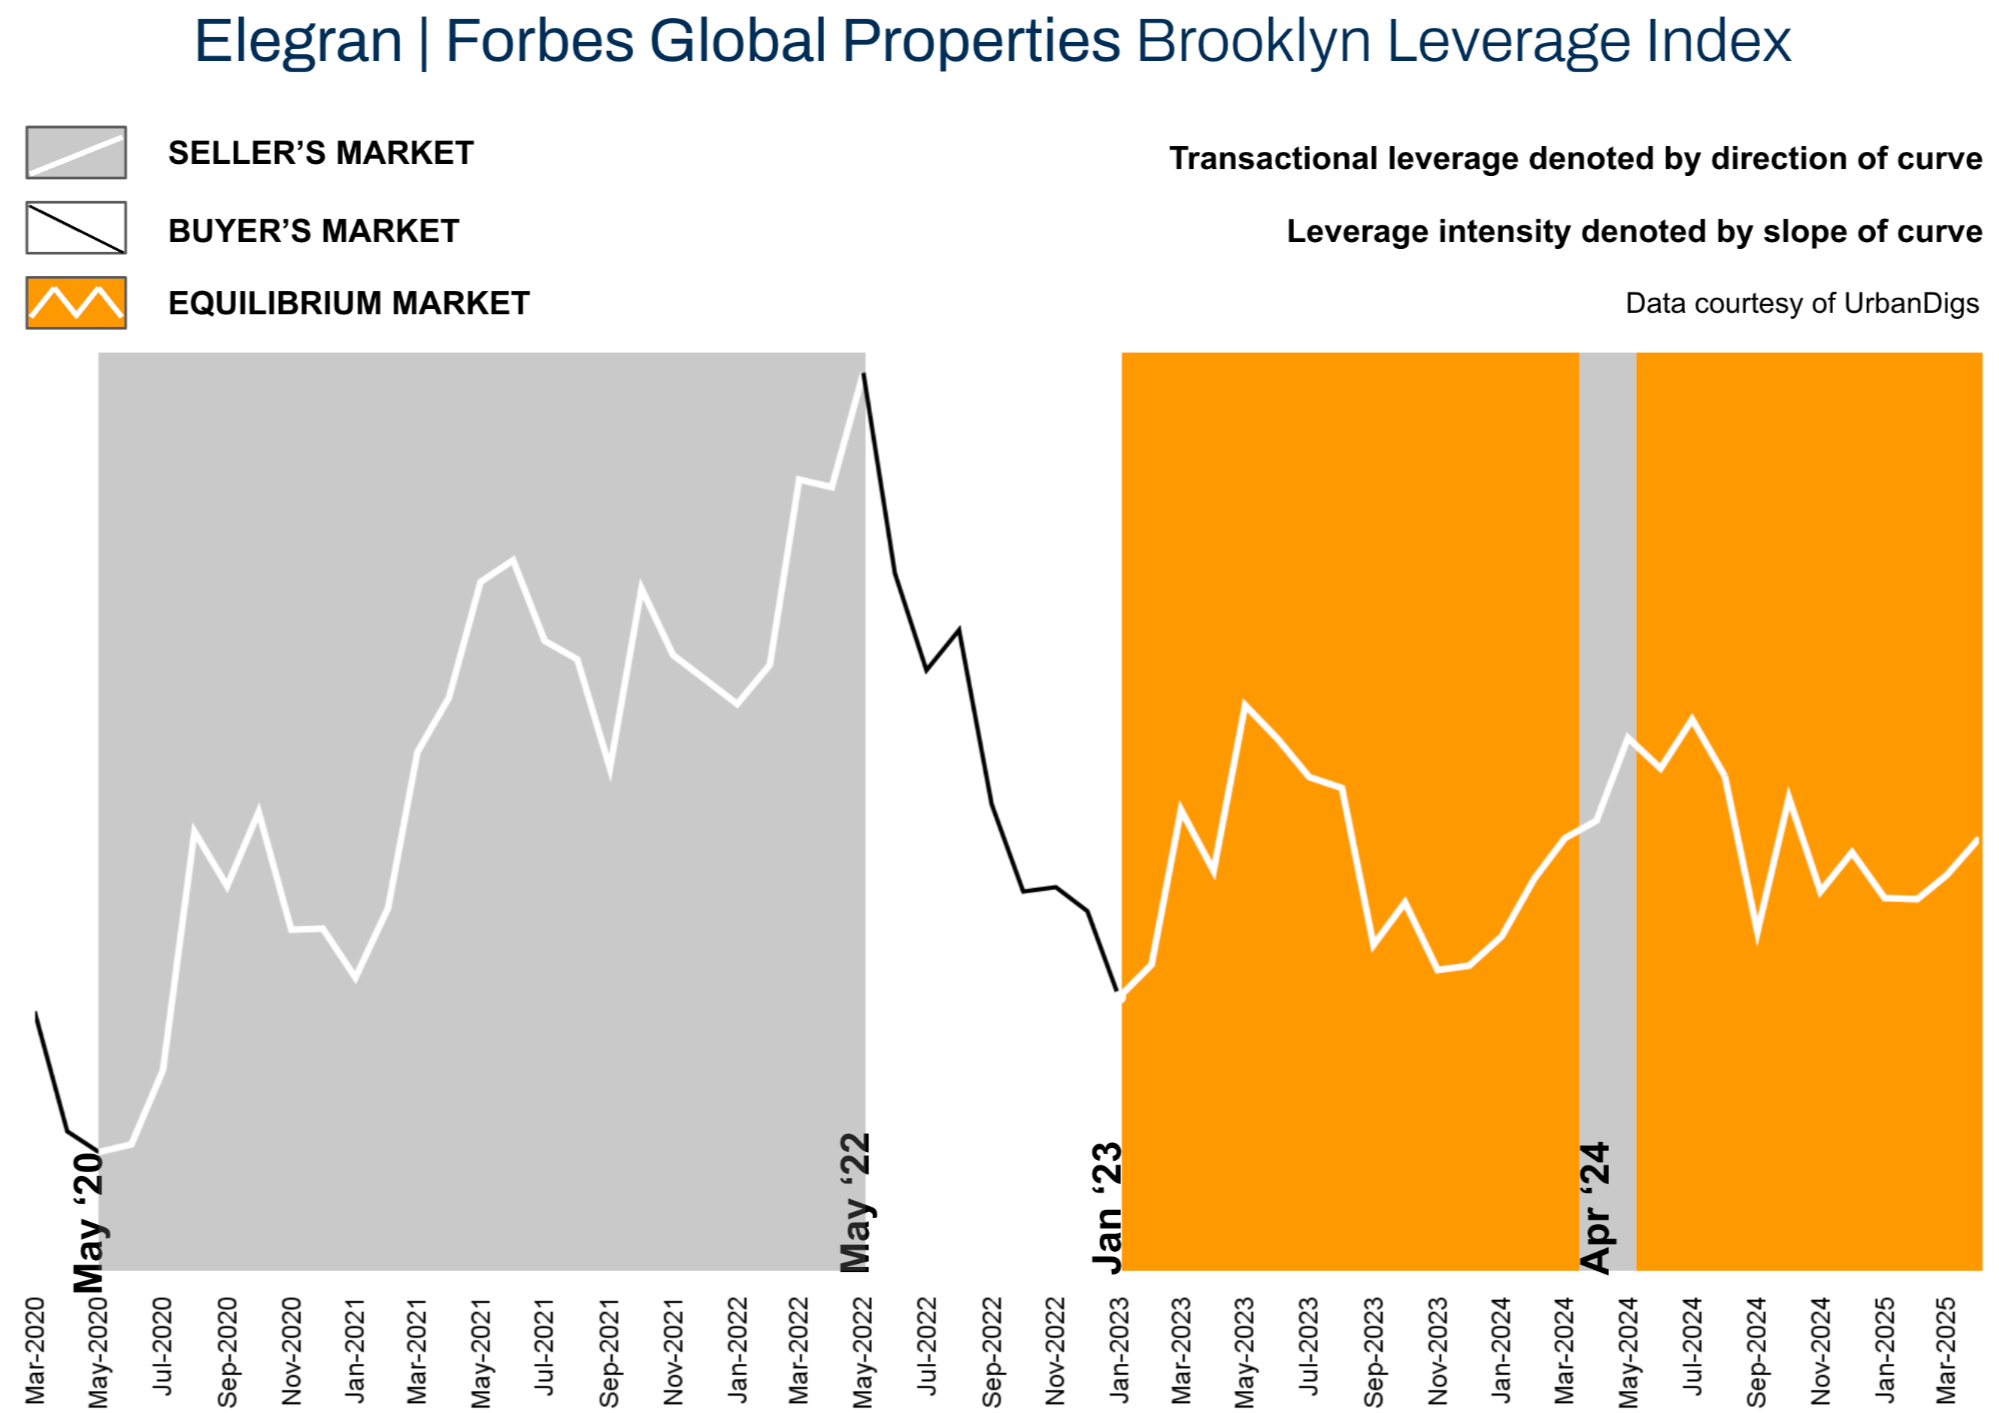
That’s the key difference this season: while Manhattan is gaining momentum, with a noticeable uptick in contract velocity, Brooklyn is holding ground, not surging. It’s still very much a functioning, competitive, and balanced market. The Elegran | Forbes Global Properties Brooklyn Leverage Index² confirms this. After months of neutrality, the market tilted slightly in favor of sellers in early spring as contract signings rose and listing discounts narrowed. But with inventory rising 6.3% month-over-month and now up 8% year-over-year, buyer leverage is stabilizing again.
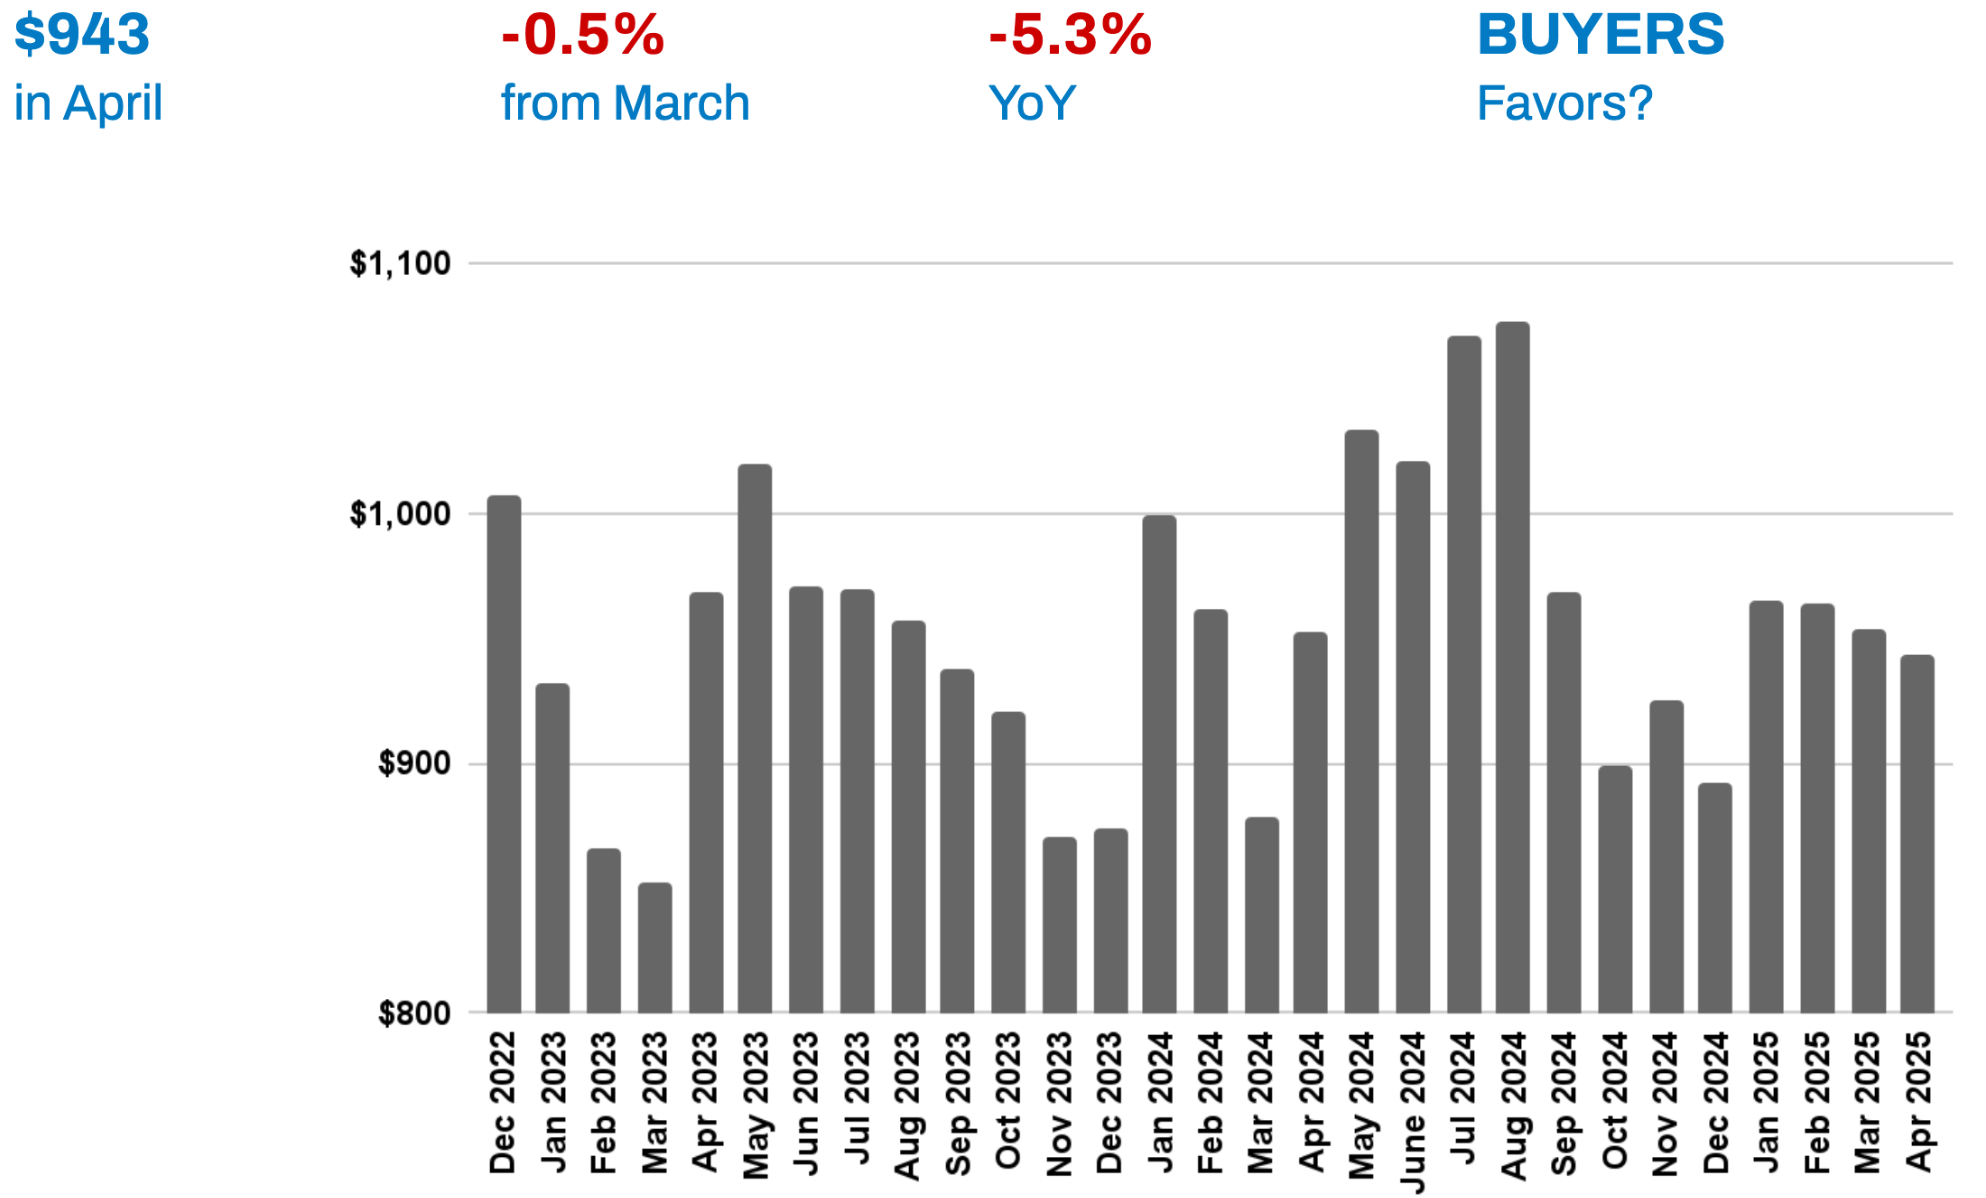
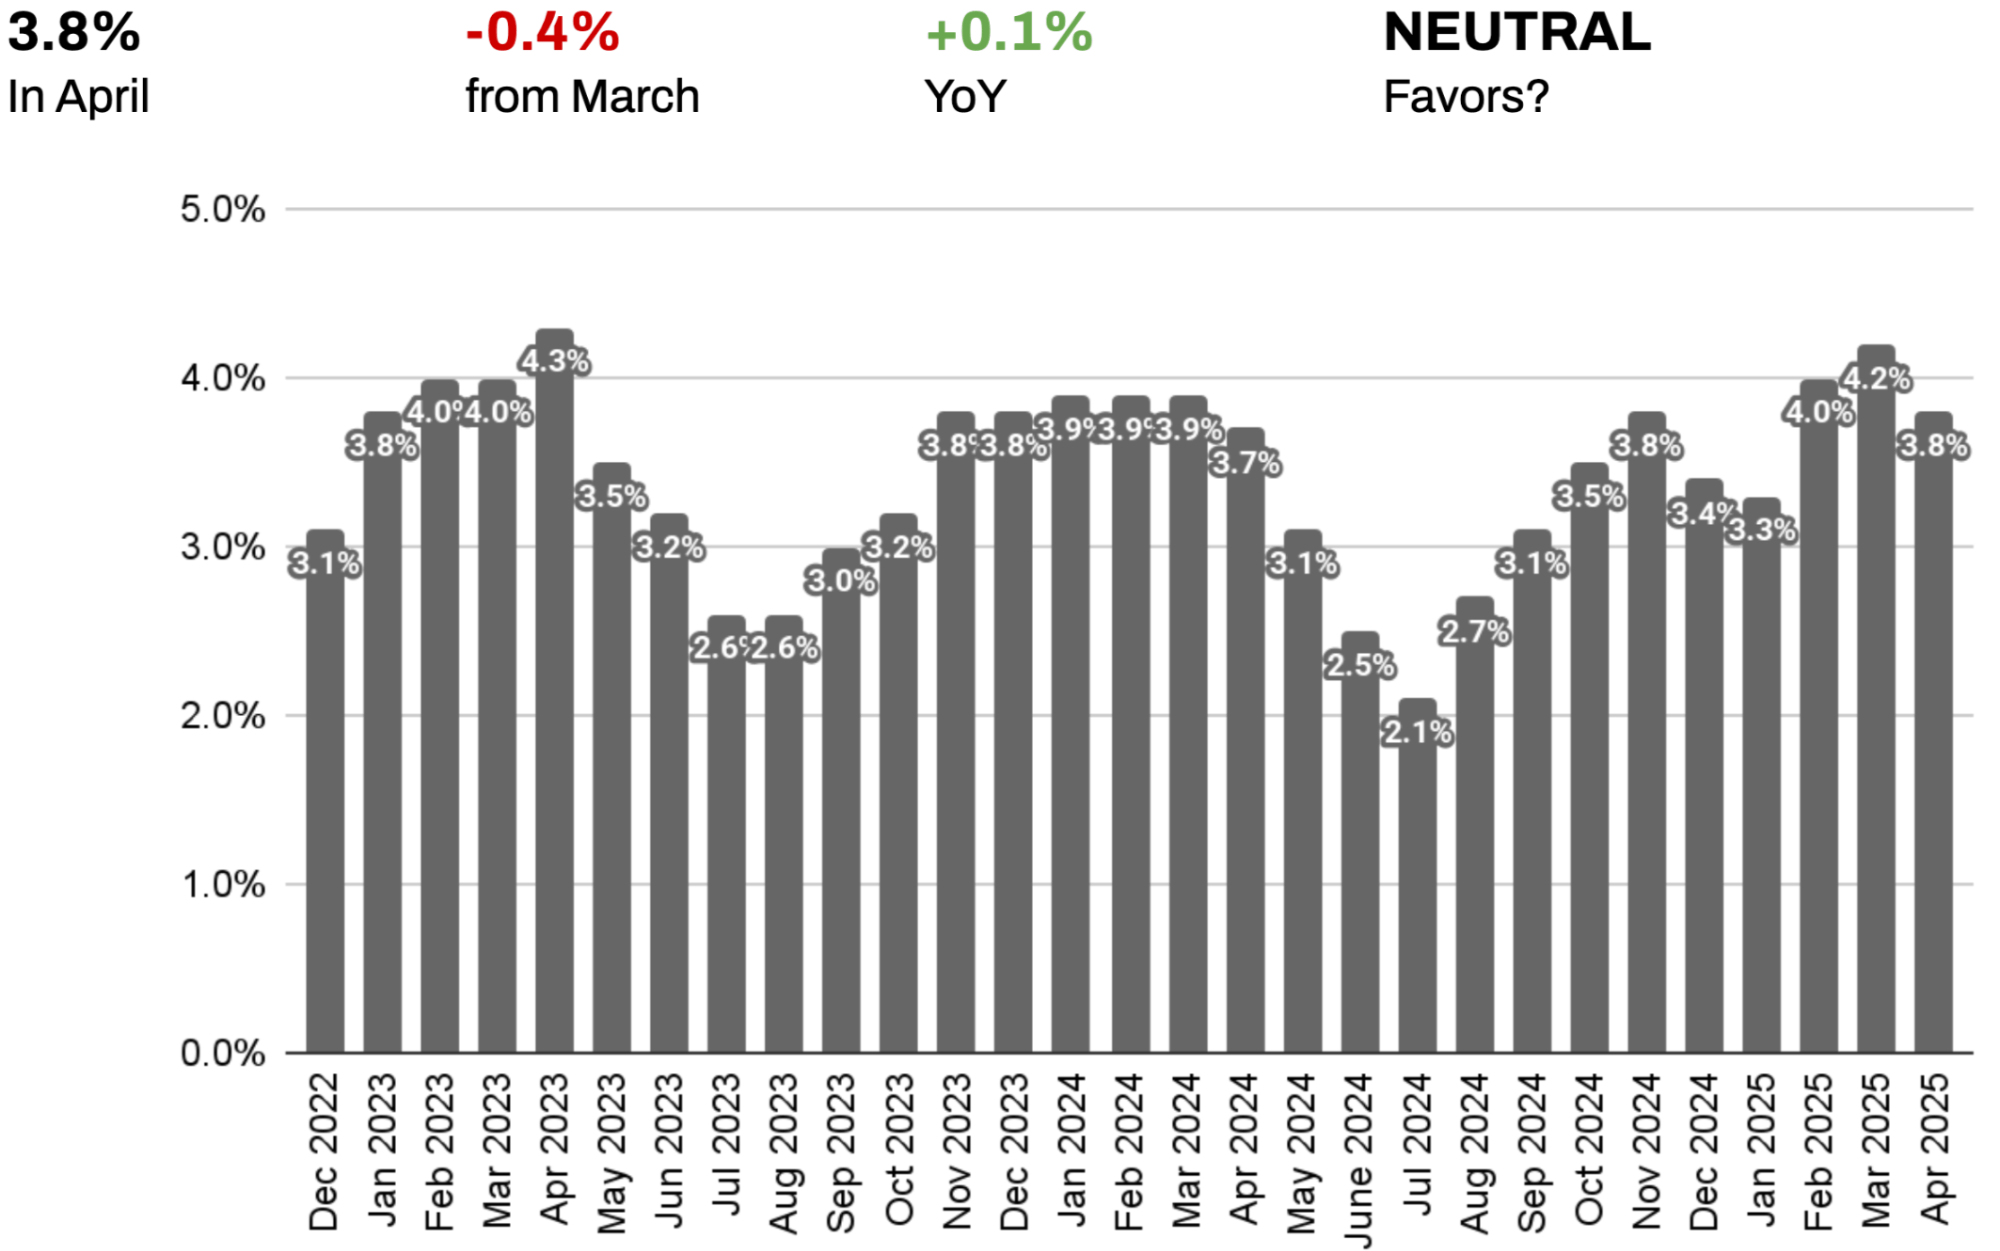
Price performance reflects this evolving dynamic. Brooklyn’s median price per square foot dipped just 0.5% in April to $943, down 5.3% year-over-year. This is less a correction than a recalibration. Some segments—especially those with surplus inventory or overly aspirational pricing—are adjusting, while well-located, turn-key properties continue to fetch competitive offers. The median listing discount narrowed to 3.8% in April, indicating that accurately priced homes are facing less negotiation and trading more efficiently.
The rental market, however, shows no signs of cooling. Brooklyn’s median rent reached another all-time high at $3,700, up 5.9% year-over-year. This marks the third consecutive month of record-setting prices, with both lease signings and rental inventory climbing. Renters are under immense pressure: strong job markets, limited affordability in the for-sale market, and high mortgage rates are keeping them on the sidelines—and driving up competition for leases. Landlords are in a commanding position, with renters downsizing or shifting neighborhoods to stay within budget.
Mortgage rates remain elevated but are no longer sidelining market participants. With jumbo rates hovering around 6.8%, the market has shifted from rate-watching to reality. Buyers and sellers are now transacting based on life events and long-term planning, not speculation. This mindset reset is fueling stable activity—what we’re witnessing now is a healthy, necessity-driven market.
Despite signs of moderation, Brooklyn remains a dynamic environment for both buyers and sellers. Buyers should act decisively on well-priced properties while supply is more favorable, and sellers should avoid overpricing, which could lead to longer days on market and deeper discounts. The next 4–6 weeks may offer the best alignment of selection and leverage before summer conditions tighten again.
As always, real estate offers something stocks and crypto cannot: stability. “Unlike stocks or crypto, your home doesn’t ping you with a minute‑by‑minute ticker of perceived value,” as noted in a recent Forbes article. “Real estate is tangible, usable, and not immediately correlated with the daily whims of public markets.” In a world full of volatility, that’s exactly why Brooklyn real estate remains such a resilient and rewarding asset.
Elegran | Forbes Global Properties Brooklyn Leverage Index
The Elegran | Forbes Global Properties Brooklyn Leverage Index is powered by four indicators: supply, demand, median price per square foot (PPSF), and median listing discount.
It informs us whether the current is a buyer’s or a seller’s market, i.e., which party possesses transactional leverage. Looking at the graph below, this is indicated by the direction of the curve, where:
- An increasing trend from left to right indicates a seller’s market
- A decreasing trend from left to right indicates a buyer’s market
Our indicator also informs us regarding the relative strength of that leverage, indicated by the slope of the curve, where:
- A gentle slope indicates a weak advantage by one party over the other
- A sharp slope indicates a strong advantage
It's not just the exact numbers that matter - it's the direction and slope of the trend. After months of balance, the spring market has started to lean toward sellers: contract signings are up, and listing discounts have narrowed month-over-month. Inventory is rising in step with demand, keeping the market competitive. The first half of spring slightly favored sellers, but the second half will determine if that edge holds.
Brooklyn Supply
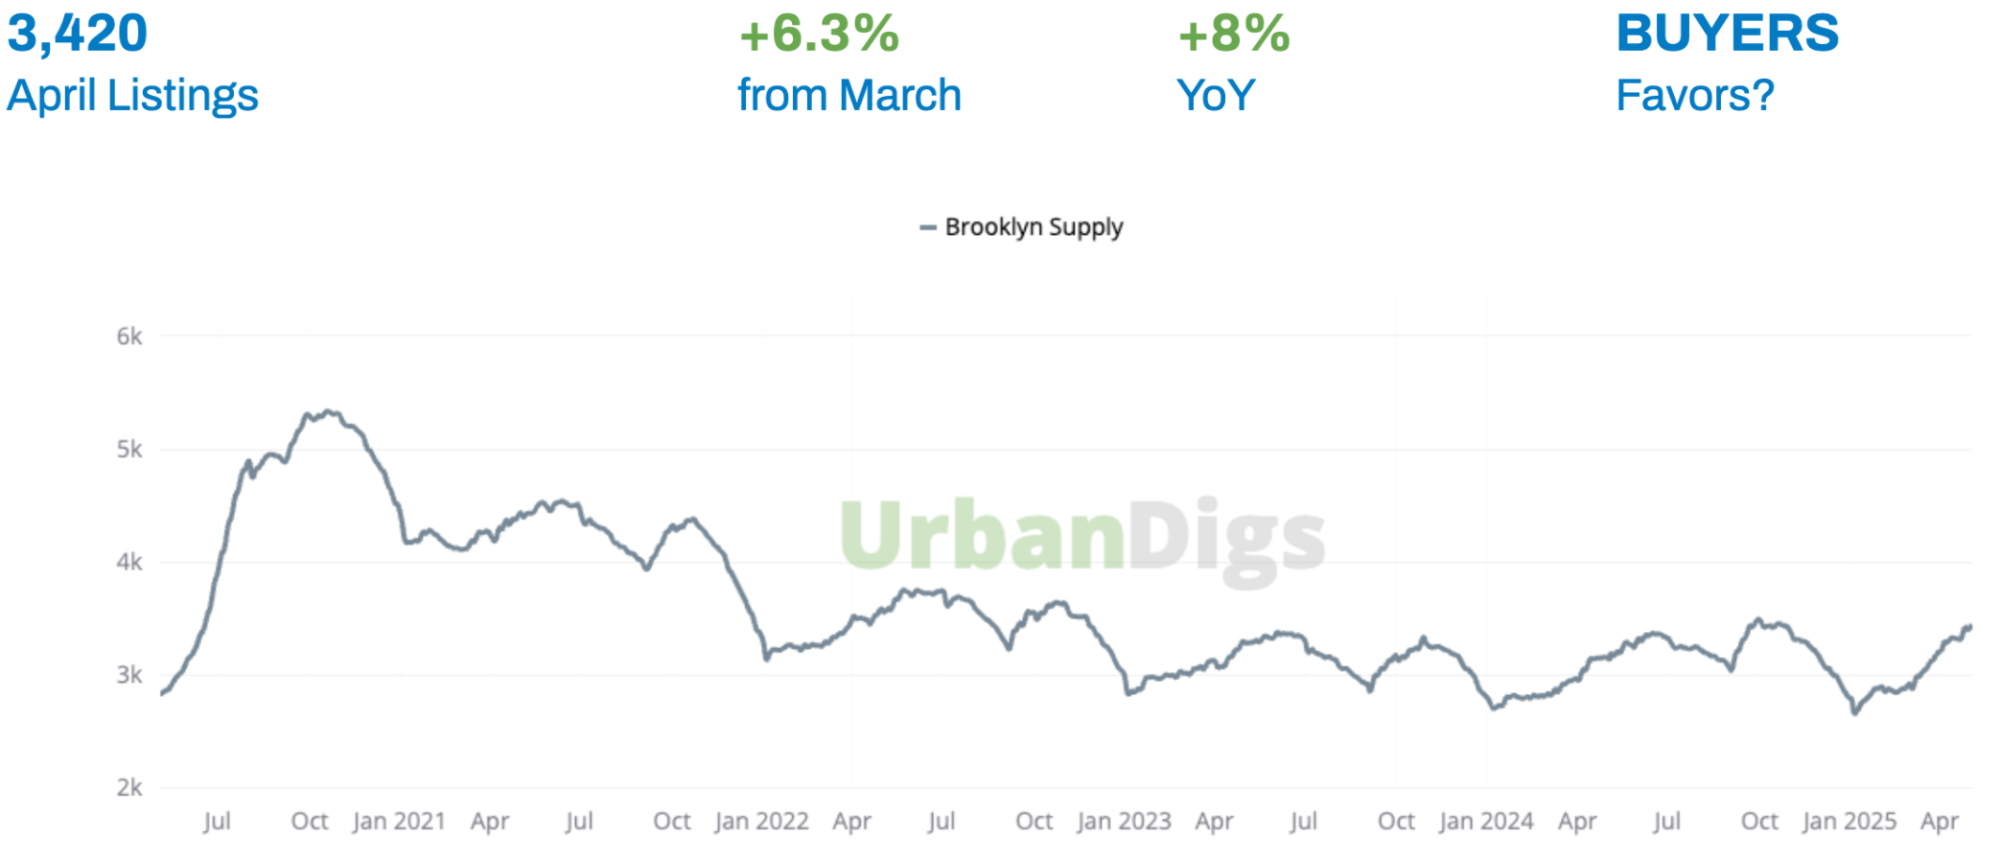
Data & chart courtesy of UrbanDigs
Brooklyn Inventory Grows—But Remains Historically Tight
Brooklyn’s active residential listings climbed 6.3% in April to 3,420, continuing the expected spring uptick and representing an 8% increase year-over-year. While this growth offers welcome breathing room for buyers, supply remains well below pre-2022 norms. This isn’t a market shift—it’s a seasonal swell.
Importantly, inventory grew faster than contract activity (up 5% year-over-year), which means the market feels slightly more balanced than last spring: slightly less competitive for buyers, and slightly more competitive for sellers. But demand is still strong, particularly for well-priced, move-in-ready homes.
What This Means for You:
BUYERS: The next 4–6 weeks may be your best shot at selection and leverage. Inventory is rising now, but with serious buyers already in the market, top-tier homes are going quickly. Don’t wait for a discount—focus on value.
SELLERS: More listings mean more options for buyers—and more competition for you. Pricing and presentation will determine whether you stand out or get overlooked. This is not the time to test the market; it’s the time to win it.
Looking Ahead:
This is still a supply-constrained market, just slightly less so than last year. Use the spring window wisely, because Brooklyn’s fundamentals remain strong, and summer may bring tighter conditions once again.
Brooklyn Demand
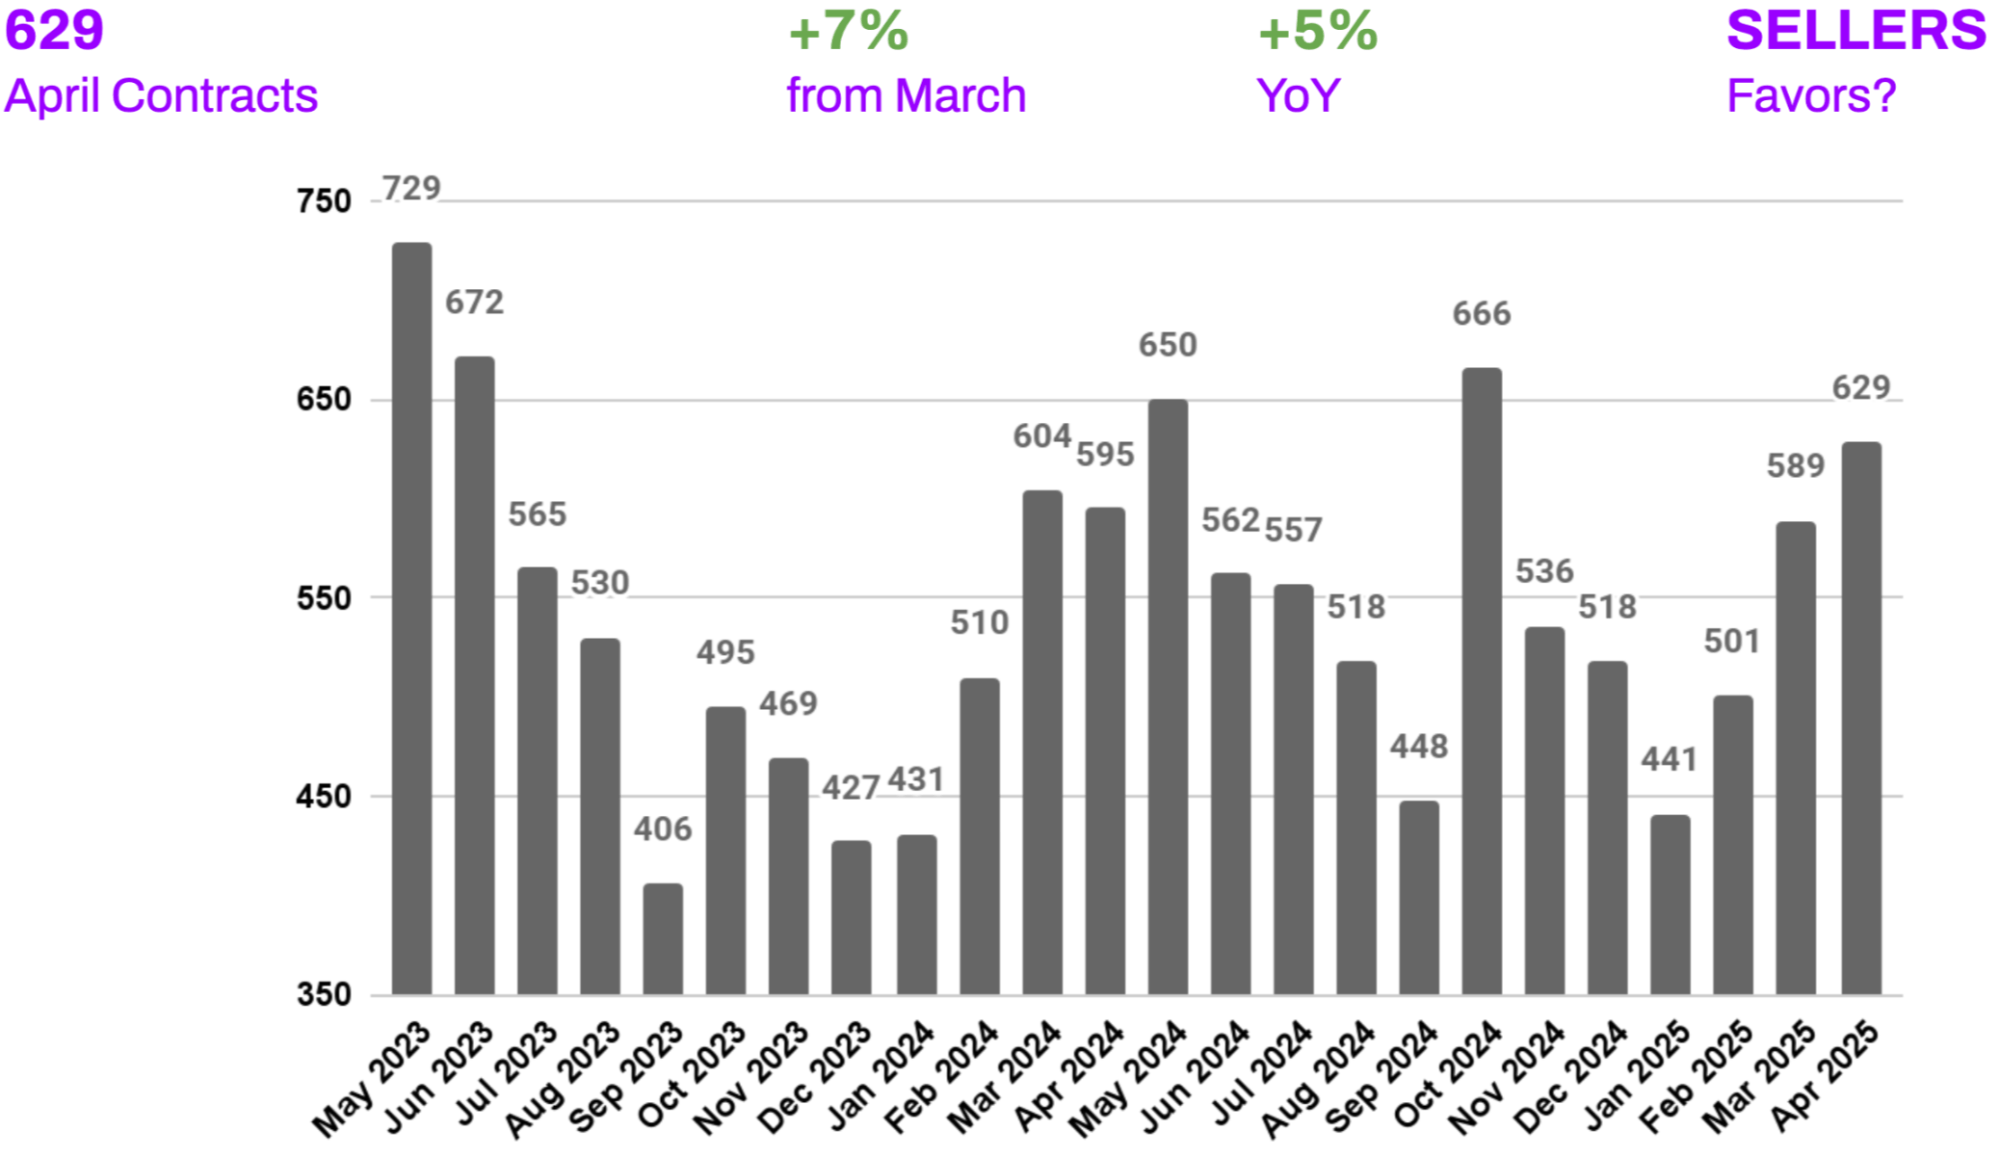
Data courtesy of UrbanDigs
Buyers Are Back—and They’re Getting Serious
Brooklyn logged 629 signed contracts in April—a 7% increase from March and a 5% rise year-over-year—confirming that buyers are re-engaging with the market, even in the face of elevated borrowing costs. This marks a return to seasonal norms and a shift in sentiment: instead of waiting for rates to drop, buyers are adjusting to today’s conditions and moving forward.
After trailing below average in Q1, April’s contract volume caught up to Brooklyn’s monthly pace—an encouraging sign that confidence is returning. Though still below the feverish activity of 2021 and early 2022, the market is finding its footing in a new, more measured cycle.
What This Means for You:
BUYERS: Momentum is building. Inventory is improving, but so is competition. The best homes are attracting multiple offers, some above asking. If you see a good fit, act fast and put your best foot forward.
SELLERS: Demand has returned. If you’ve been waiting to list, this may be your best window. Buyers are out there—and they’re ready to transact.
Looking Ahead:
This is a market driven by real life, not rate speculation. Milestones like births, marriages, and job changes are powering activity—and that’s a sign of long-term market health. If rates stay steady, expect continued contract strength through May and June.
Brooklyn Median PPSF
Data & chart courtesy of UrbanDigs
Brooklyn Price Dip Creates Targeted Opportunities for Buyers
Brooklyn’s median price per square foot dipped 0.5% month-over-month to $943, marking a 5.3% decline year-over-year. While this signals softening, it’s not a correction—it’s a recalibration. The broader market remains stable, but certain segments are adjusting to increased inventory and more selective buyers. This kind of pricing movement is nuanced—not all neighborhoods or property types are affected equally. In fact, current PPSF levels remain consistent with April 2023 and 2024, reinforcing the notion of normalization, not decline.
What This Means for You:
BUYERS: Your dollar may stretch further today, especially in segments with rising supply. While standout listings in top-tier locations still command a premium, savvy buyers find real value in homes that have lingered on the market or been repriced. These overlooked opportunities can yield both lifestyle and investment upside.
SELLERS: Pricing power isn’t lost—it’s just more strategic. Buyers are informed, measured, and focused on value. Listings that align with current comps and offer compelling design, layout, or location are still winning attention—and in some cases, drawing multiple offers. This isn’t the time for wishful pricing—it’s the time for accurate positioning.
Looking Ahead:
Brooklyn continues to offer long-term value. Its mix of character, lifestyle, and relative affordability remains compelling. With buyer momentum building, this soft pricing window may begin to close as we move deeper into the summer market.
Brooklyn Median Listing Discount
Data courtesy of UrbanDigs
Overpricing Costs More: Strategic Sellers See Smaller Discounts
Brooklyn’s median listing discount narrowed to 3.8% in April—a 0.4% drop from March—signaling a shift in seller behavior and buyer response. While still 0.1% higher than a year ago, the trend points toward growing market efficiency: sellers are entering the market with more realistic pricing, and buyers are responding with stronger, quicker offers.
The gap between listing and selling prices is closing, but not evenly. Well-priced homes are moving with minimal negotiation, while overreaching listings continue to face steeper markdowns over time. The message is clear: sellers who meet the market are being rewarded, and buyers who hesitate on fair-value listings risk missing out.
What This Means for You:
BUYERS: Lowball offers are losing traction. With tighter discounts and faster absorption of well-priced homes, success now hinges on recognizing value early and acting decisively. Don’t mistake efficiency for softness—this is a disciplined market.
SELLERS: The data supports smart pricing. Homes that align with buyer expectations from the outset are trading faster and with fewer concessions. Pricing just above your target outcome—not aspirational highs—creates momentum and minimizes discounting.
Looking Ahead:
This is a market that’s growing more efficient by the week. If current demand holds, expect discount rates to compress even further. Sellers are adjusting, and buyers are following suit, setting the stage for a busy and competitive summer season.
Rental Remarks
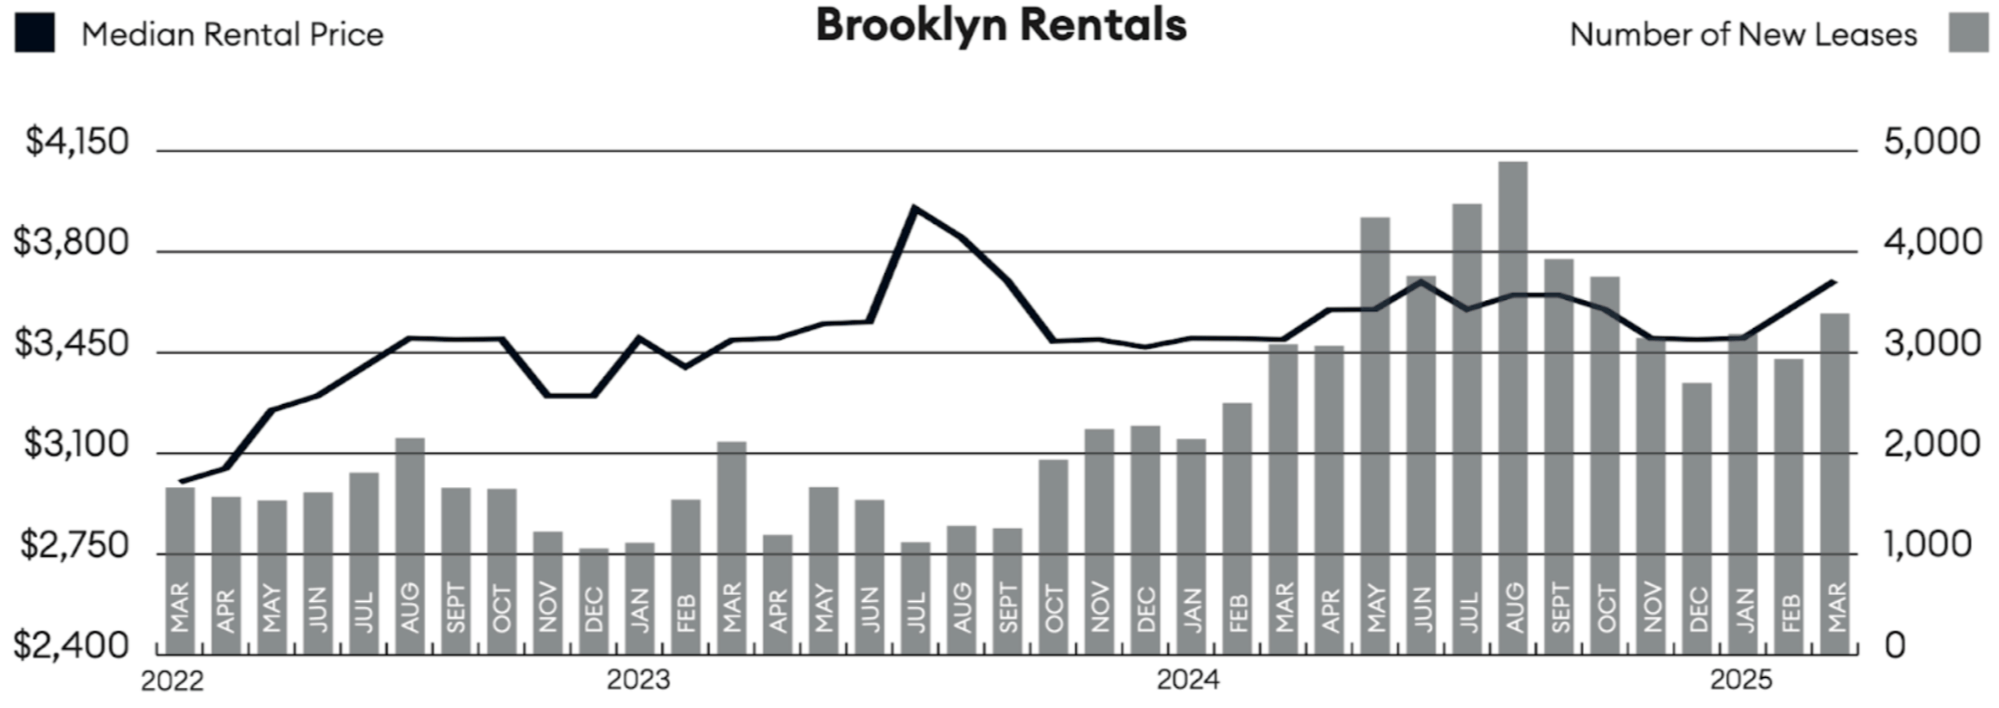
Chart courtesy of Miller Samuel, Inc.
Brooklyn Rental Market Hits New Highs as Demand Overpowers Seasonality
Brooklyn’s rental market continued its record-breaking run in March, with median rents rising 2.8% to $3,700—a 5.9% increase year-over-year and the highest level on record. Average rent per square foot also reached a new peak for the third consecutive month, underscoring unrelenting demand across the borough.
Despite surging costs, both lease signings and active inventory climbed above 2024 levels, signaling sustained—and even accelerating—market activity. Elevated mortgage rates, strong employment figures, and high population retention keep many would-be buyers in the rental market, intensifying pressure on pricing. This isn’t a typical spring surge; it’s a structural squeeze, and Brooklyn remains the epicenter.
What This Means for You:
RENTERS: This is a high-stakes market. Median rent at $3,700 is stretching budgets and outpacing wage growth. Move quickly, explore up-and-coming neighborhoods, and look for potential concessions in new developments. Consider longer-term leases to lock in rates before summer demand sends prices even higher.³
LANDLORDS: You’re in a strong position. Rent growth of nearly 6% year-over-year justifies measured increases while maintaining occupancy. Renters are downsizing and trading space for location and amenities, especially in transit-rich areas. Strategic upgrades and cosmetic improvements continue to deliver strong returns in this high-demand environment.
Looking Ahead:
Brooklyn’s rental market isn’t just strong—it’s defying gravity. With summer ahead, further price gains are likely before any leveling off occurs. For renters, this means making fast, informed decisions. For landlords and investors, it’s an ideal window to capture yield and evaluate expansion into high-growth pockets of the borough.
Mortgage Remarks
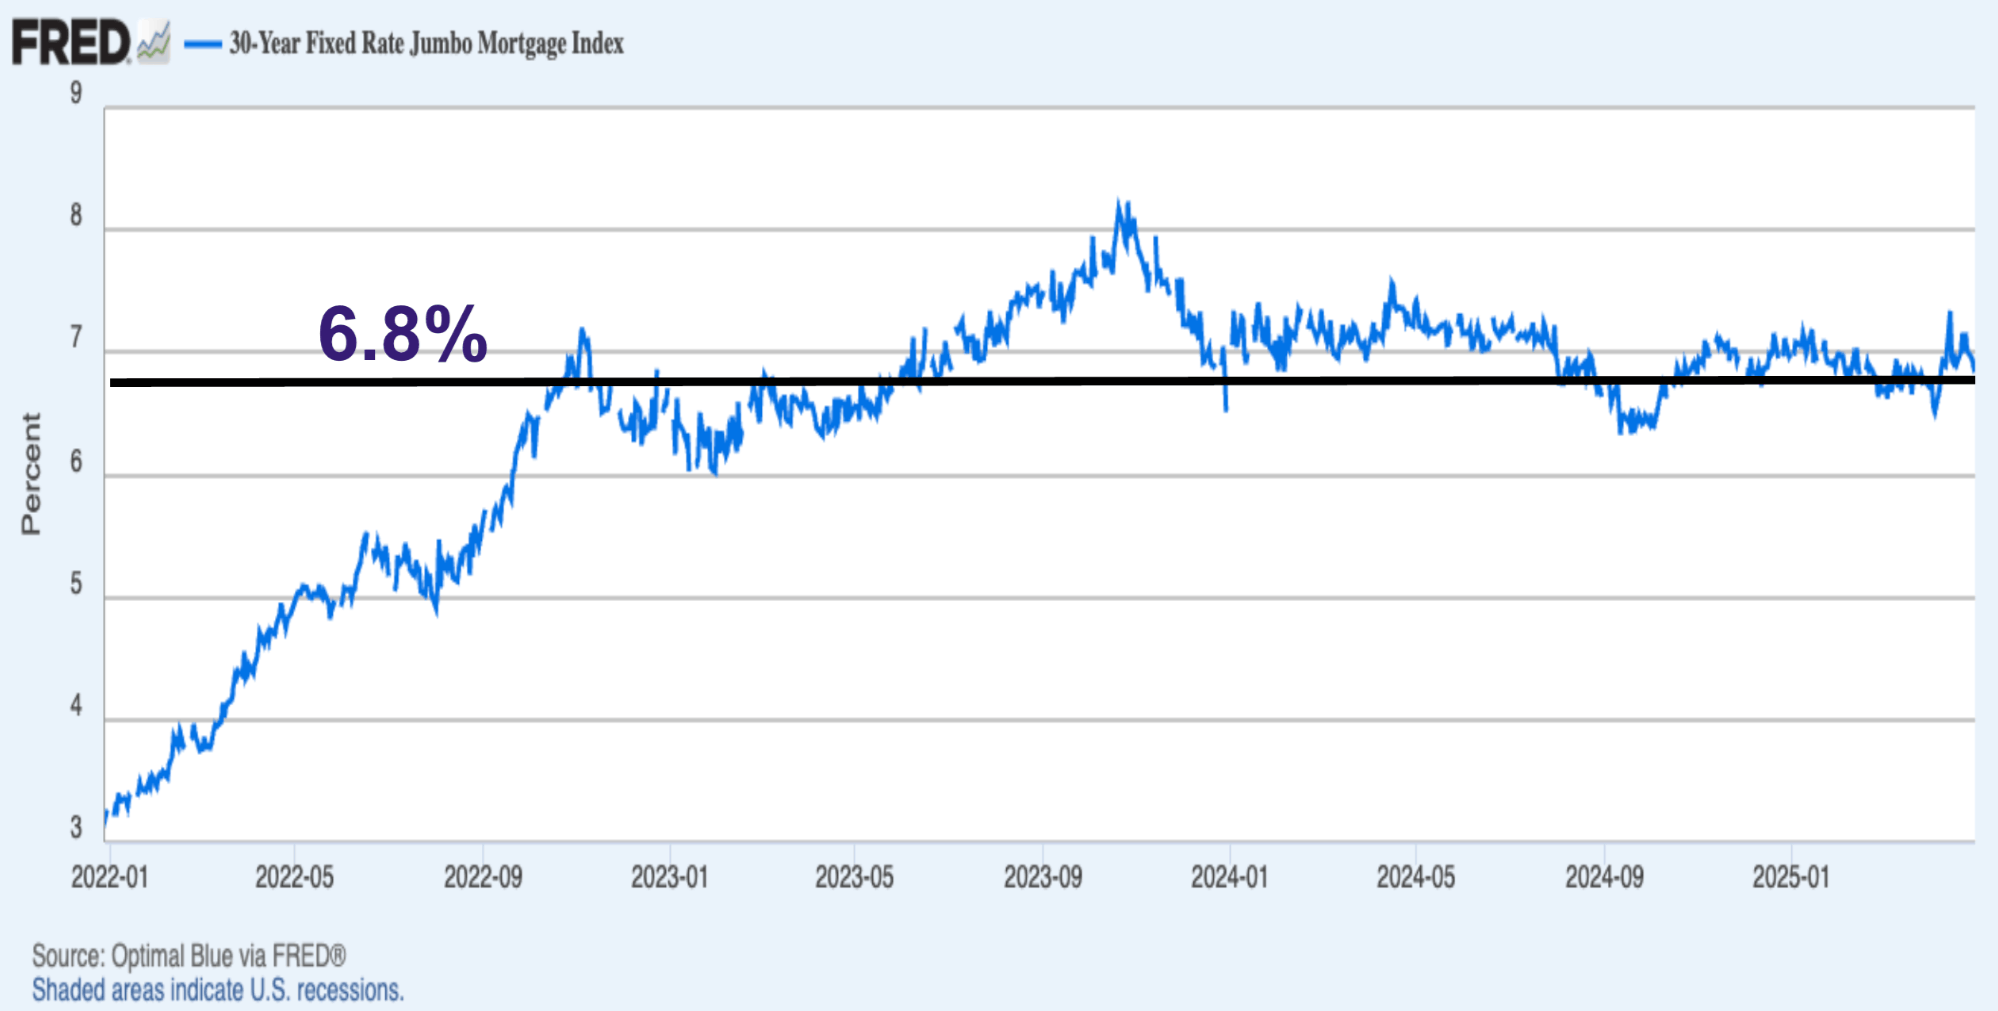
The 30-Year Fixed JUMBO Mortgage Index currently sits at 6.8%⁴, with an average APR of 6.4%⁵. Rates eased slightly in late April following their post-tariff spike, but remain above March levels, though still lower than the peaks of January and early February.
The prevailing view? Rates in the mid-6% range are the new normal. Barring a major economic shift, most experts expect this level to persist into 2026.
But here’s what’s changed: interest rates no longer dictate market behavior. Buyers and sellers have stopped waiting for a drop. Instead, they’re transacting based on life events, job changes, and long-term plans, marking a decisive shift from speculation to necessity.
This mindset reset is fueling steady transaction volume, even with elevated borrowing costs. The market is no longer paused—it’s progressing, with participants adapting to reality rather than resisting it.
Investor Insights
The total return on real estate investments is driven by net rental income and capital appreciation. Brooklyn cap rates are currently between 3% and 3.4% for all-cash investors. Unfortunately, investors using a large percentage of leverage face challenges in generating net income, given the average JUMBO mortgage APR of 6.4%. Timing and a strong USD may afford foreign investors, depending on their native currency, the opportunity to realize significant capital gains upon selling their assets.
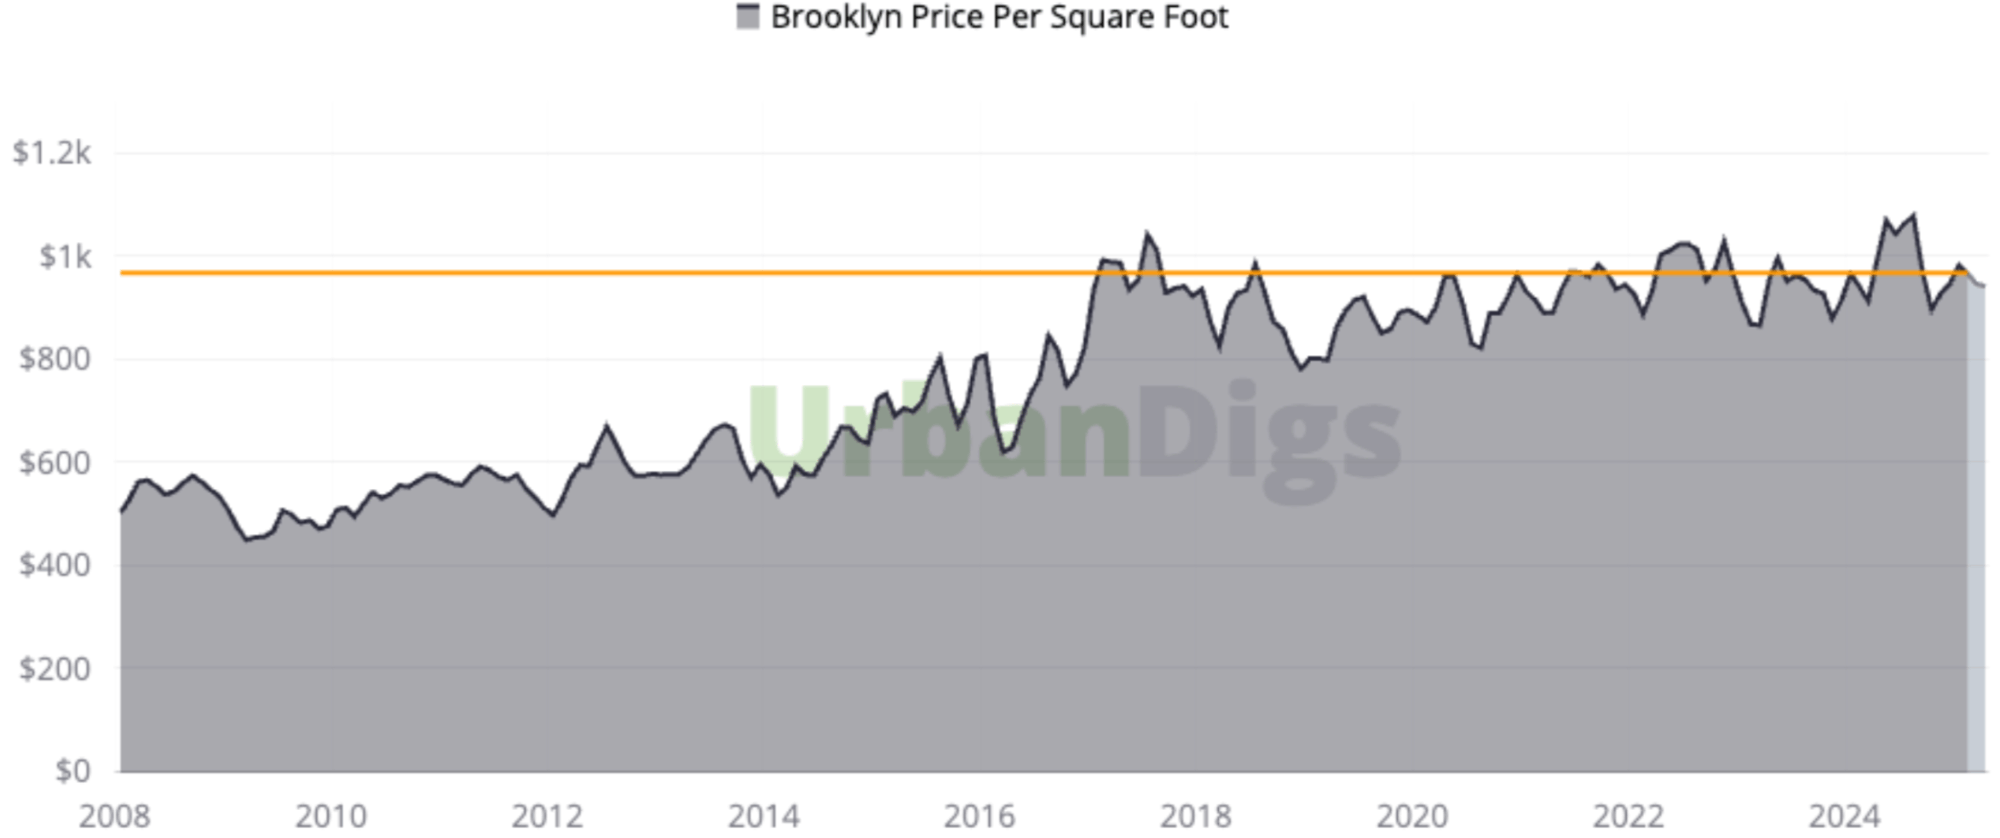
This chart, courtesy of UrbanDigs, indicates Brooklyn median PPSF as a function of the closed sale date.
The light grey area to the extreme right indicates incomplete data, and the orange line indicates the most recent median
PPSF based on data considered complete.
References
1. Data courtesy of UrbanDigs
2. According to the Elegran | Forbes Global Properties Brooklyn Leverage Index
3. Data courtesy of Miller Samuel, Inc.
4. Data courtesy of Federal Reserve Bank of St. Louis
5. JUMBO mortgage rate APR data courtesy of Bank of America, Chase, and Wells Fargo
If you would like to chat about the most recent market activity,
feel free to contact us at info@elegran.com or
connect with one of our Advisors.
About Us
Welcome to Elegran | Forbes Global Properties, where our mission is to revolutionize the world of real estate. Founded in 2008 by Michael Rossi, our journey began with an unwavering drive for motivation, innovation, and a genuine care for our clients.
As an independently owned brokerage, we pride ourselves on our elite team of "advisors," offering a personalized touch that goes above and beyond the traditional real estate experience. Armed with robust data insights, we empower our clients to make informed decisions that lead to success.
Distinguished as the exclusive member of the invitation-only Forbes Global Properties network in NYC, Elegran proudly stands at the forefront of excellence. This exclusive partnership broadens our horizons, enabling us to connect buyers, sellers, and investors with extraordinary luxury properties not only in New York City but across the globe.
Our passion lies in turning your real estate dreams into reality, and we are committed to providing exceptional service at every step of the journey.
Are you ready to experience the Elegran difference? Dive into the possibilities at www.elegran.com and embark on an unforgettable real estate adventure with us.
Categories
Recent Posts


Stay in the Know!
Sign up to receive our monthly newsletter
GET MORE INFORMATION