
Elegran Manhattan Market Update: DECEMBER 2023

Manhattan Market Update: Equilibrium is Not Neutrality
Sales Insights:
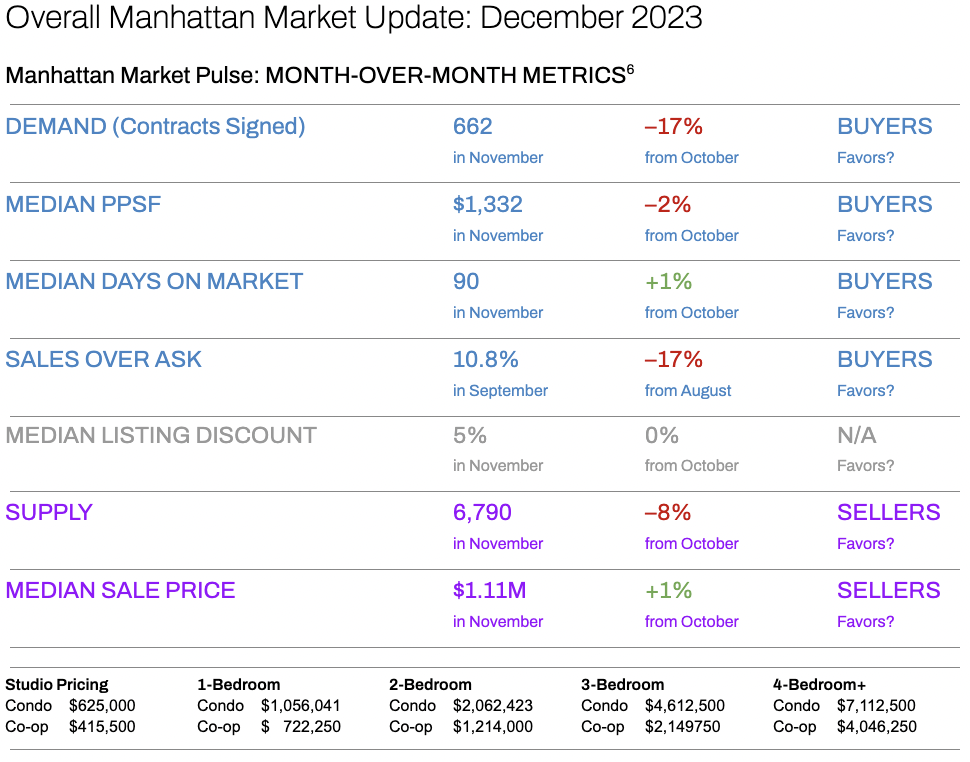
“Neutral” markets don’t exist because buyers and sellers are constantly playing tug-of-war for leverage. Over the past 7 months, there’s no clear winner as buyers & sellers reach equilibrium¹.
- Last month, sellers had a small advantage.
- This month, buyers possessed a slight edge:
-
- Demand (measured by contracts signed) was down, in their favor.
- Median PPSF (Price Per Square Foot) was down, in their favor.
- Median Days on Market were up, in their favor.
- Sales Over Ask was down, in their favor.
Rental Insights:
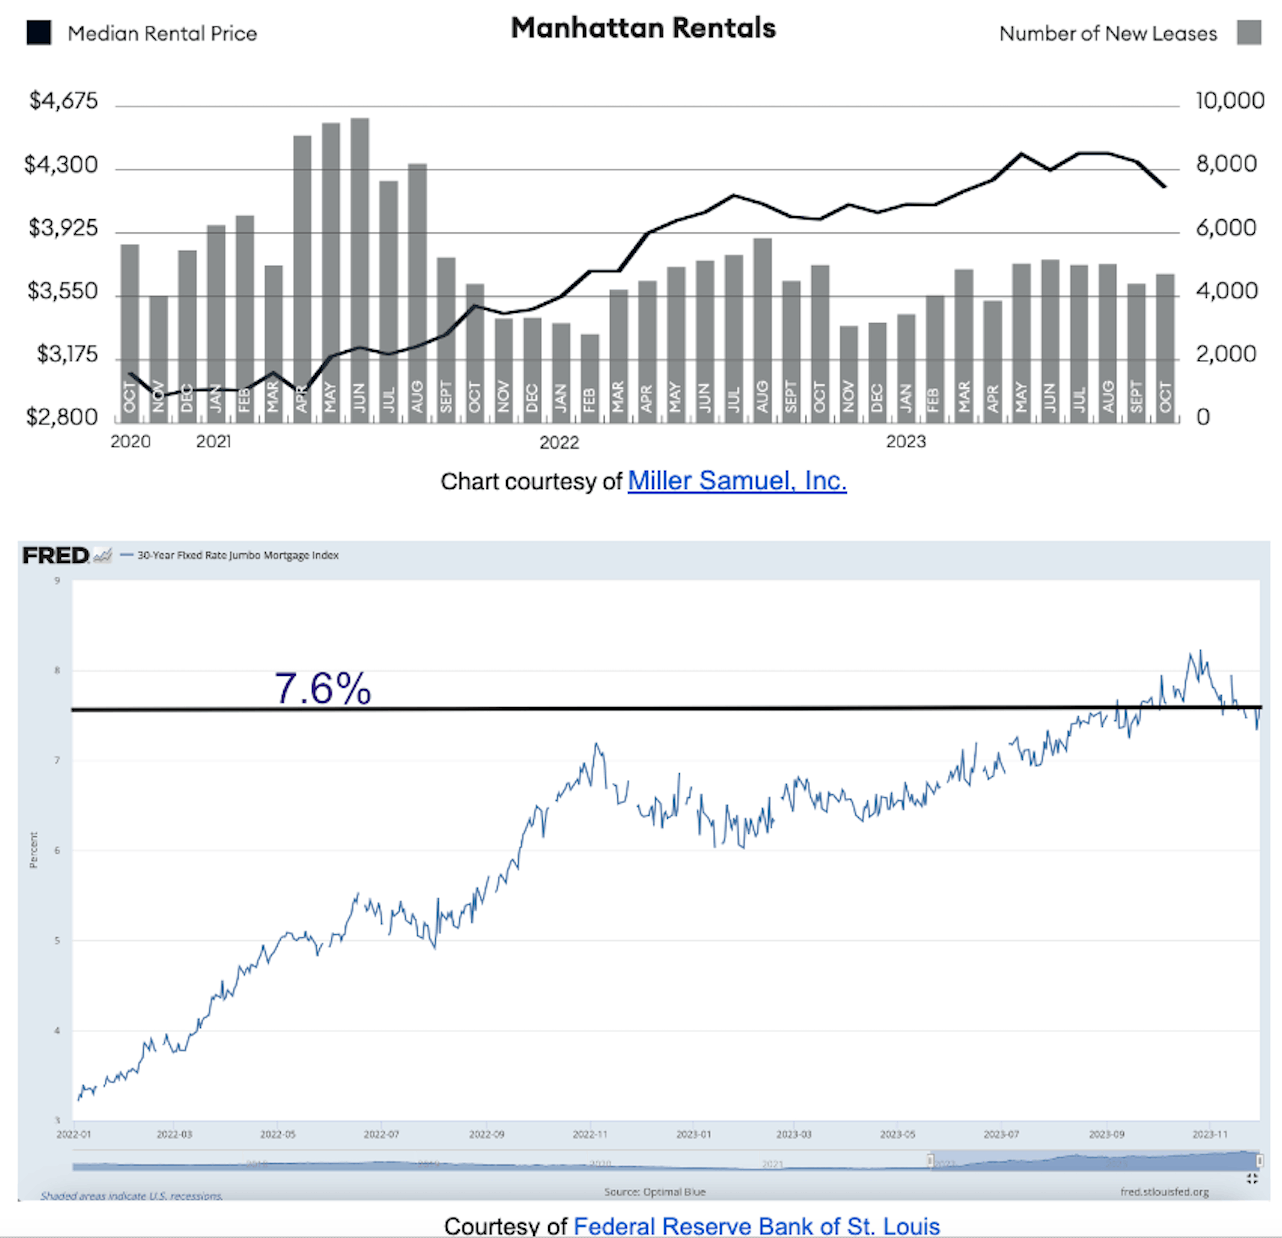
From the all-time high of $4,300 in May & July, the median rental price has retreated slightly to $4,100².
- The rent versus buy scale may feel equally punitive on both sides, with rents near all-time highs.
- Mortgage rates are near their decades-long high as well.³
Investment Insights:
Total return is generated by net rental income & price appreciation.
- All-cash buyers can expect a cap rate between 2.5% - 3%.
- Since the average JUMBO mortgage rate APR is 6.862%⁴, there is no net rental income on
- leveraged purchases.
- The COVID rebound is fully realized.⁵ Any potential for future capital appreciation will be generated by future price inflation.
- Depending on when they purchased and their national currency, foreign investors may experience robust return upon sale.
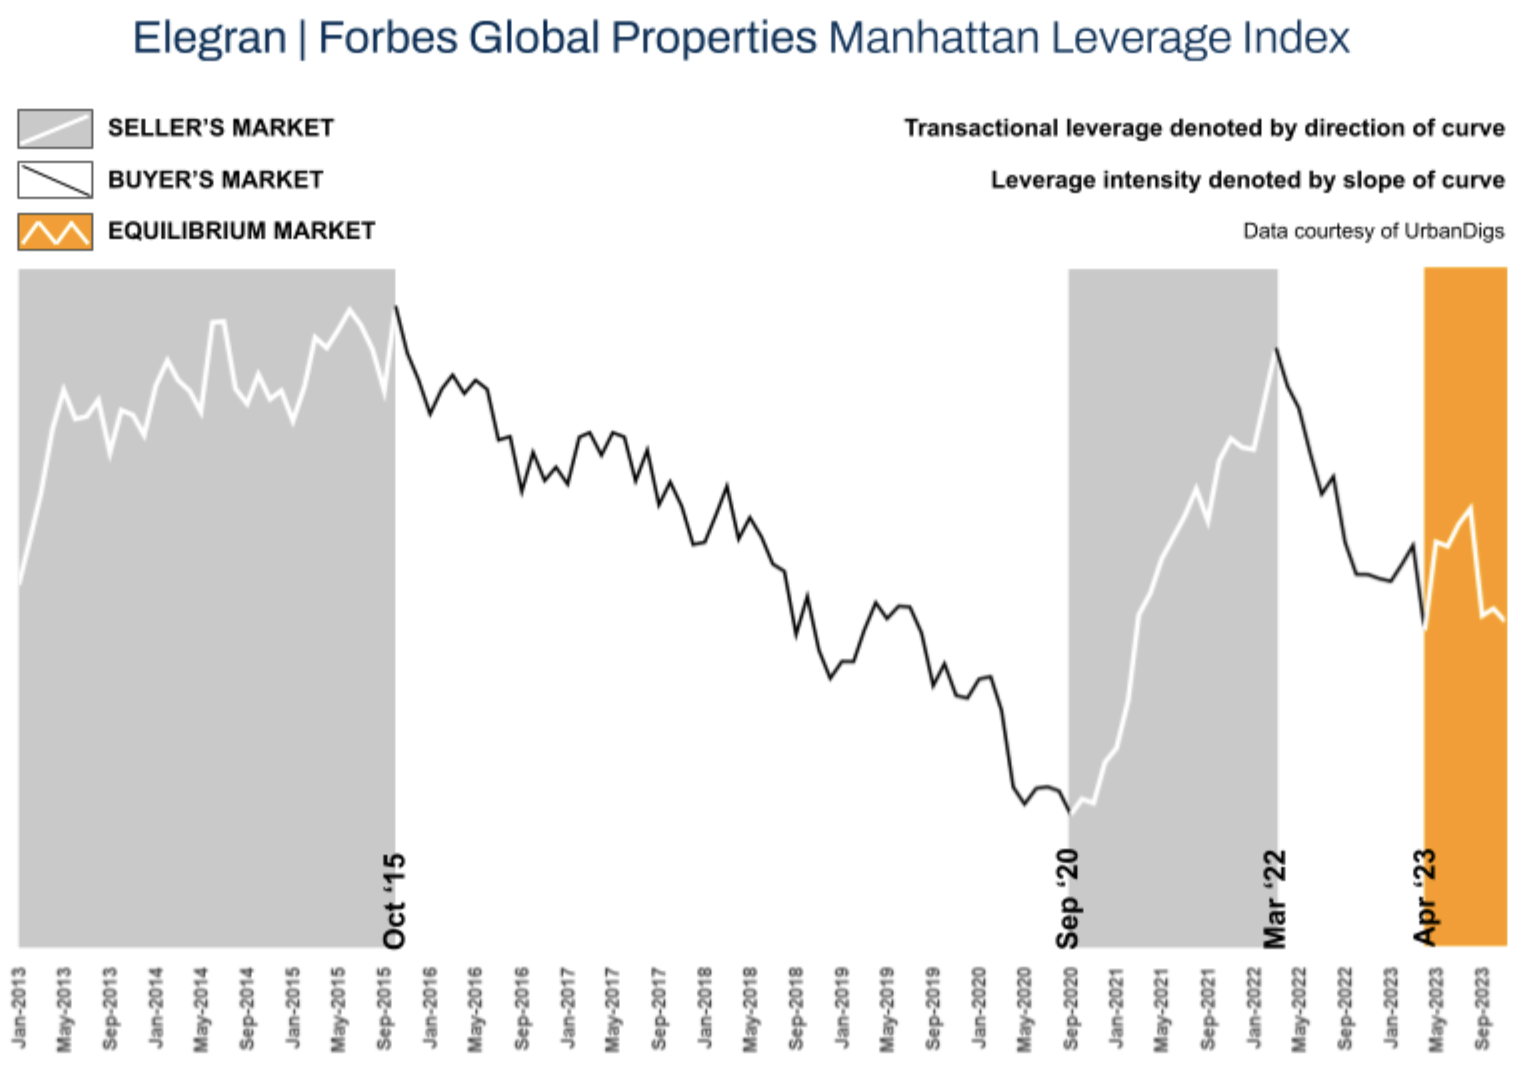
Elegran | Forbes Global Properties Manhattan Leverage Index
The Elegran | Forbes Global Properties Manhattan Leverage Index is powered by four key metrics and how they've been trending since the last month: SUPPLY, DEMAND, MEDIAN LISTING DISCOUNT, MEDIAN PRICE/SF.
The index informs us who holds the upper hand in real estate transactions—buyers or sellers. Looking at the graph below, this is indicated by the direction of the curve, where:
- An increasing trend from left to right indicates a seller’s market
- A decreasing trend from left to right indicates a buyer’s market
Our indicator also informs us regarding the relative strength of that leverage, indicated by the slope of the curve, where:
- A gentle slope indicates a weak advantage by one party over the other
- A sharp slope indicates a strong advantage
In April, the Leverage Index registered –24, and in November, –20. So, 6 months later, essentially back to where it started. But it’s not the numbers that are important. What is important is the direction and slope of the curve. And the curve between April and November has been anything but flat. There has been an intense leverage tug-of-war between buyers and sellers. Last month, sellers pulled the metaphorical rope in their direction. This month, buyers gained back that ground.
Let's now dive into the specifics of the market forces and examine the intricate dynamics shaping the market.
Manhattan Supply
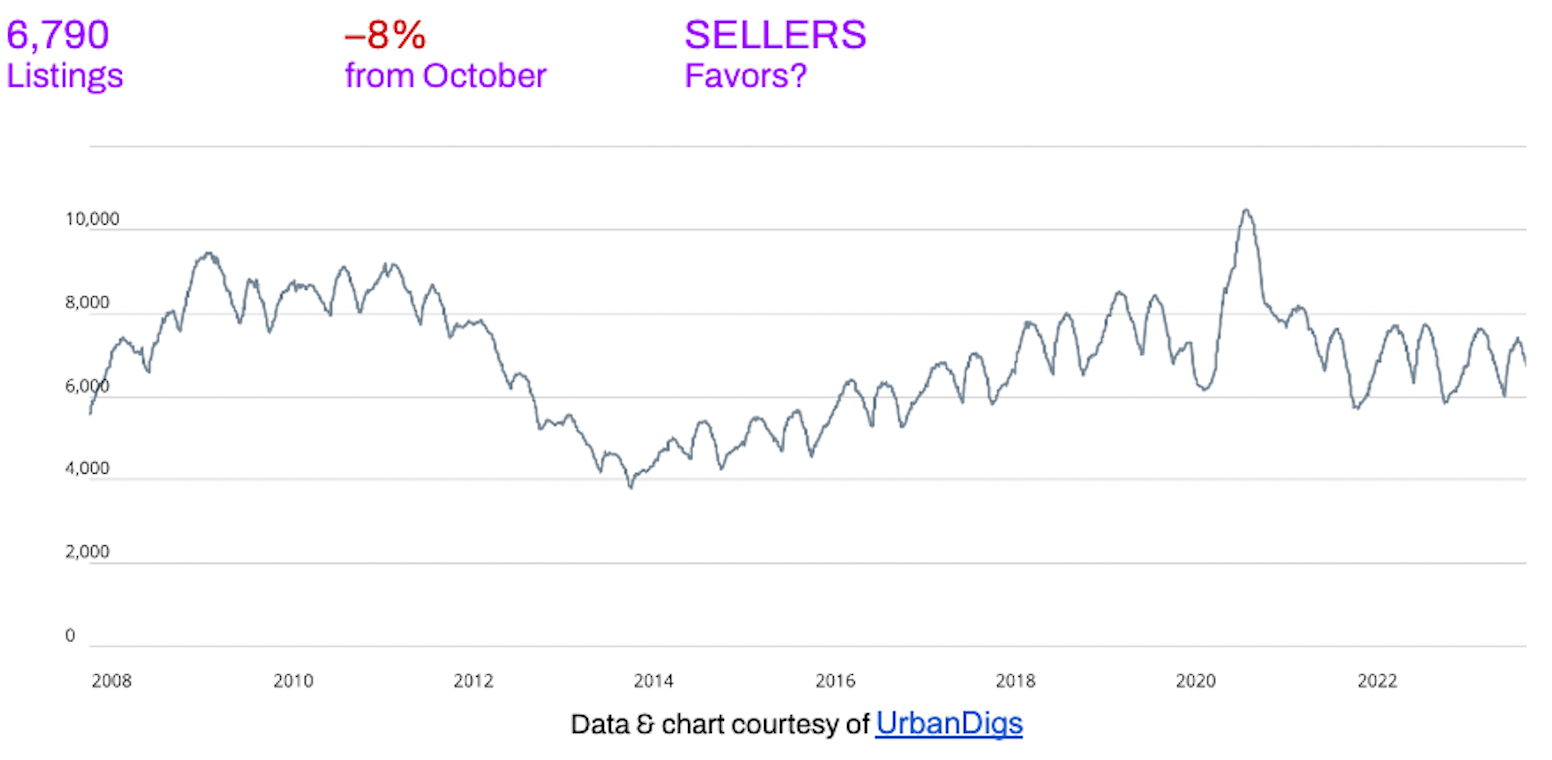
Manhattan supply has followed a similar cadence for the past decade, except during the pandemic, as the chart above clarifies. A sharp decline in the metric defines November. What does this mean for…
- BUYERS? Supply, which peaked in October, is retreating rapidly.
- SELLERS? Competition, which peaked in October, is rapidly retreating.
Manhattan Demand
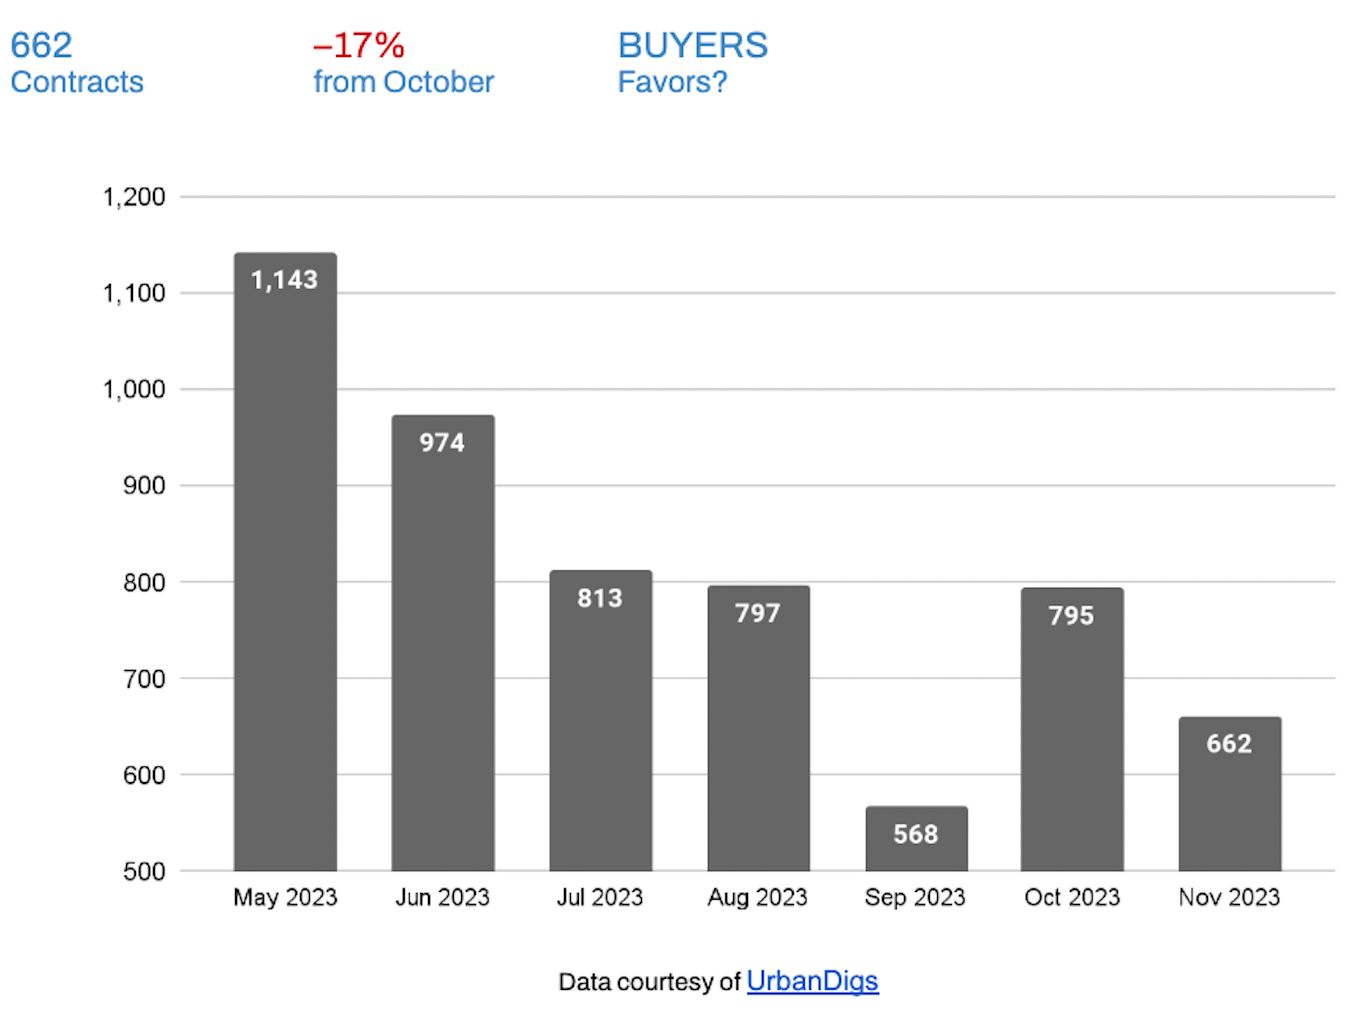
After demand (measured by contracts signed) bounced back 40% in October, it retreated again in November. What does this mean for…
- BUYERS? Less competition.
- SELLERS? Less activity.
Manhattan Median Price/SF
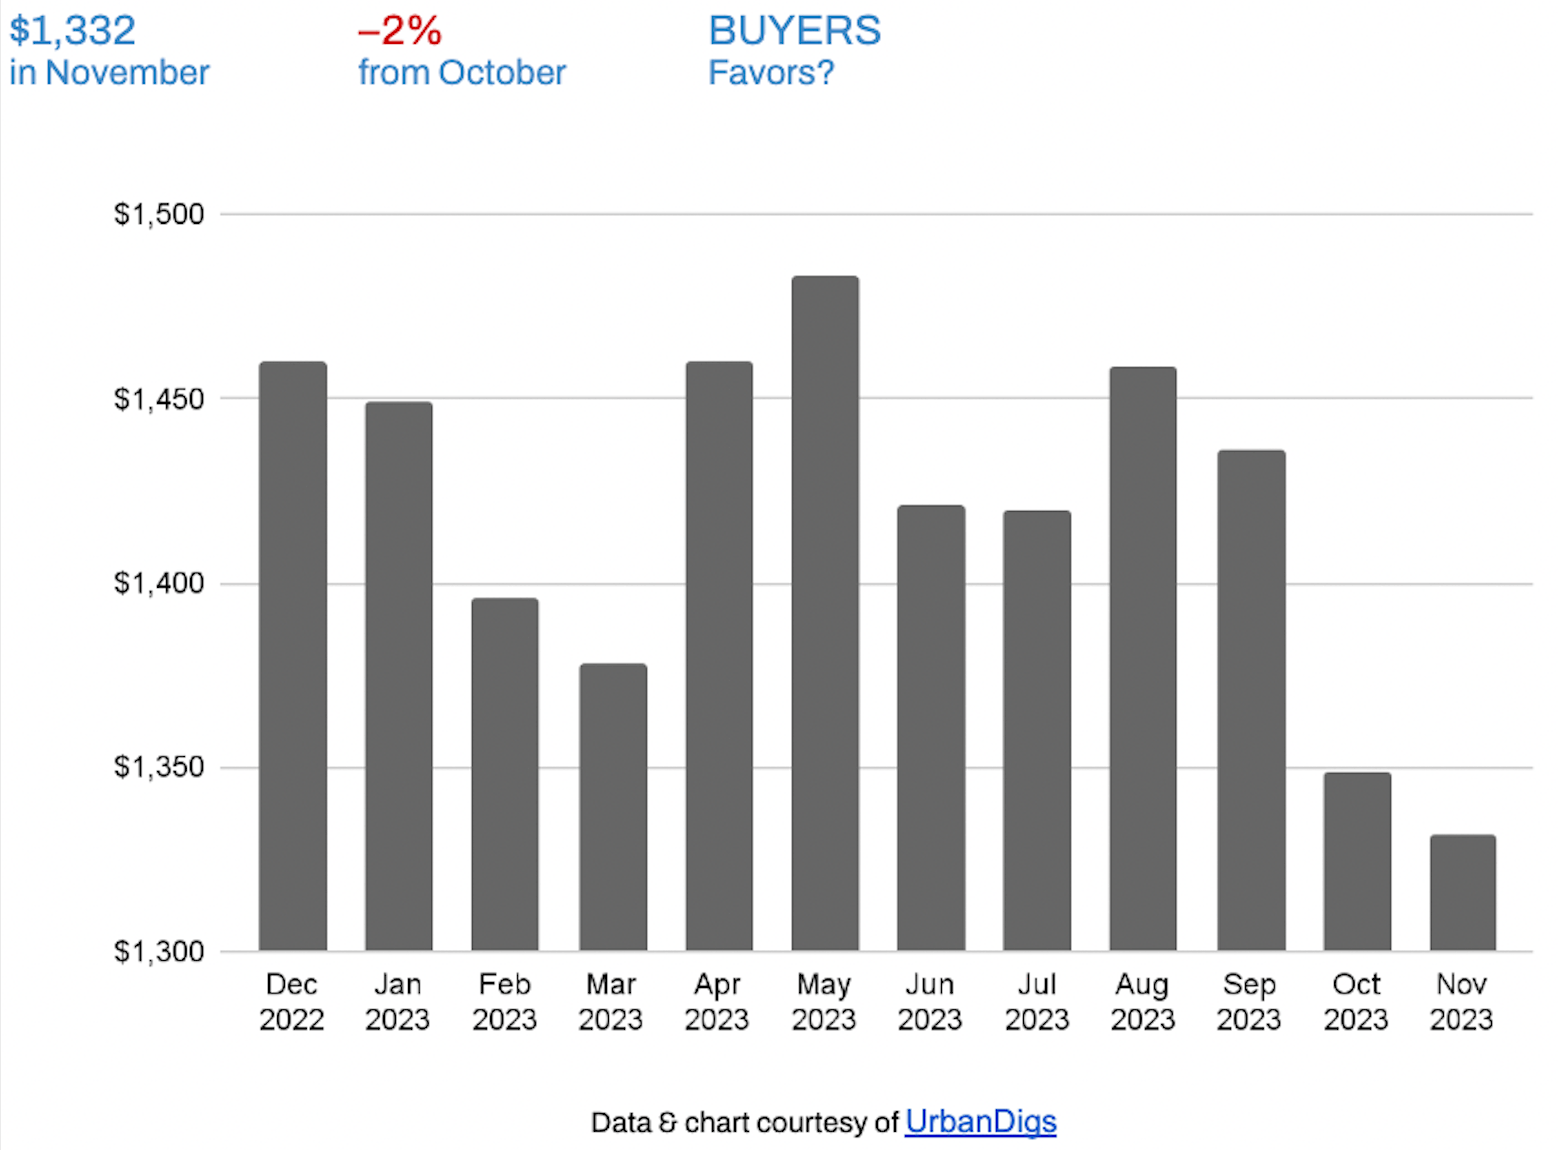
The median PPSF is at the lowest point in the past 12 months and down 10% from May’s high. What does this mean for…
- BUYERS? Prices are moving in their favor.
- SELLERS? Prices are moving against their interests.
Manhattan Median Listing Discount
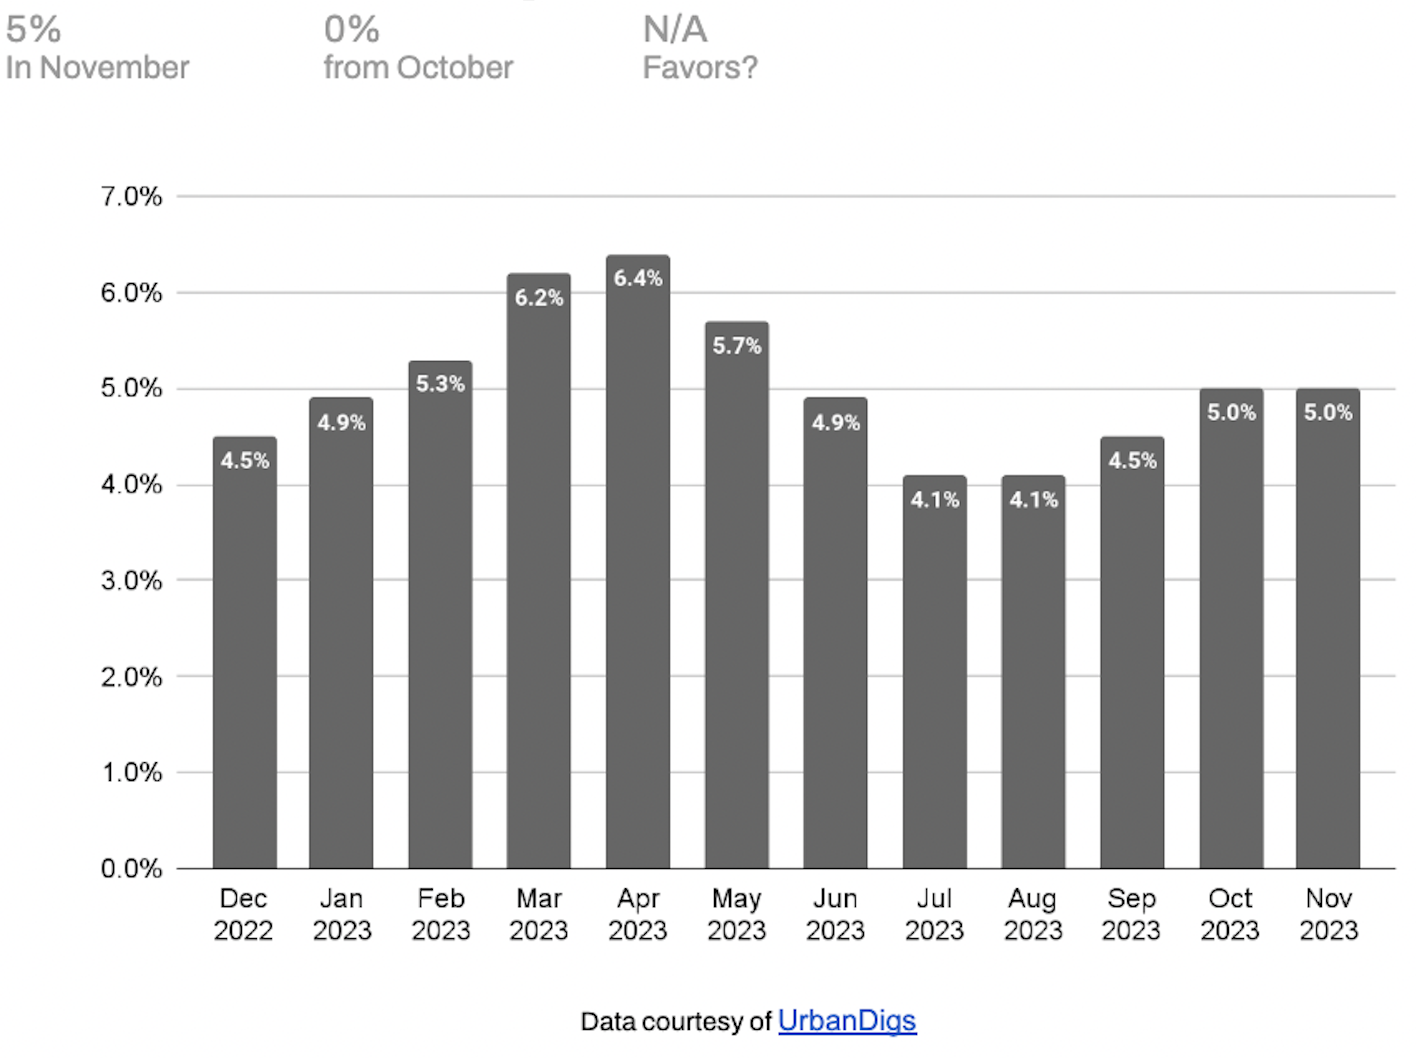
After a steep decline in Q2 and an uptick in September and October, the metric leveled off this month. At this point, neither party is provided leverage from the direction of discounts.
Rental Remarks
In October⁶, the median rent in Manhattan cooled slightly from the summer high but remains near record highs. The 30-Year Fixed Rate JUMBO Mortgage Index⁷ is trending at 7.6%, and the average JUMBO APR is 6.862%⁸. So, it’s a “catch-22” for renters, as the rent versus buy scale may feel equally punitive on both sides.
Investor Insights
The total return is driven by net rental income and capital appreciation. For all-cash investors, Manhattan cap rates are currently 2.5 - 3.0%. Unfortunately, for those investors using a large percentage of leverage, there is no net income potential, with the average JUMBO mortgage APR at 6.862%. On the sell side, the COVID rebound is now fully realized, so any potential for future capital appreciation will be generated by future price inflation. Timing and a strong USD may afford foreign investors, depending on their native currency, the opportunity to realize significant capital gains upon selling their assets.
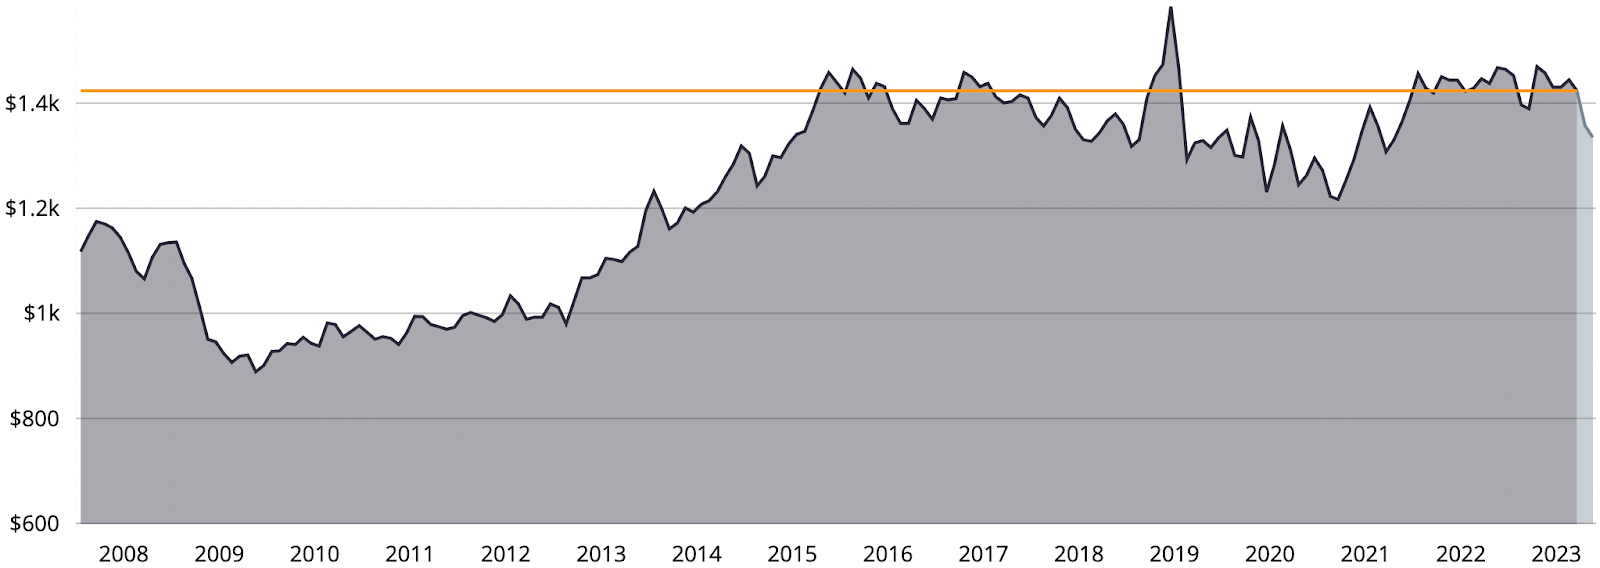
Chart courtesy of UrbanDigs and indicates Manhattan median PPSF as a function of the closed sale date. The light gray area to the extreme right indicates incomplete data, and the orange line indicates the most recent median PPSF based on data considered complete.
¹According to the Elegran | Forbes Global Properties Manhattan Leverage Index
²Data courtesy of Miller Samuel, Inc.
³ Mortgage data courtesy of fred.stlouisfed.org
⁴ JUMBO mortgage rate APR data courtesy of Bank of America, Chase, and Wells Fargo
⁵ Data courtesy of UrbanDigs
⁶November 2023 data is not yet available
⁷ Data courtesy of Federal Reserve Bank of St. Louis
⁸JUMBO mortgage rate APR data courtesy of Bank of America, Chase, and Wells Fargo
If you would like to chat about the most recent market activity, feel free to contact us at info@elegran.com or connect with one of our Advisors.
About Us
Welcome to Elegran, where our mission is to revolutionize the world of real estate. Founded in 2008 by Michael Rossi, our journey began with an unwavering drive for motivation, innovation, and a genuine care for our clients.
As an independently owned brokerage, we pride ourselves on our elite team of "advisors," offering a personalized touch that goes above and beyond the traditional real estate experience. Armed with robust data insights, we empower our clients to make informed decisions that lead to success.
Distinguished as the exclusive member of the invitation-only Forbes Global Properties network in NYC, Elegran proudly stands at the forefront of excellence. This exclusive partnership broadens our horizons, enabling us to connect buyers, sellers, and investors with extraordinary luxury properties not only in New York City but across the globe.
Our passion lies in turning your real estate dreams into reality, and we are committed to providing exceptional service at every step of the journey.
Are you ready to experience the Elegran difference? Dive into the possibilities at www.elegran.com and embark on an unforgettable real estate adventure with us.
Categories
Recent Posts


Stay in the Know!
Sign up to receive our monthly newsletter
GET MORE INFORMATION