
Weekly Manhattan & Brooklyn Market: 4/27

Week of 4/24/23
Resale Rebounds
Demand rebounded this week after softening last week in response to the religious and academic holidays. It was, however, bifurcated across the primary (new development) and secondary (resale) markets, with the latter reporting stronger performance. That being said, new development demand this week — as measured by contracts signed — is still on par with its pre-pandemic benchmark.*
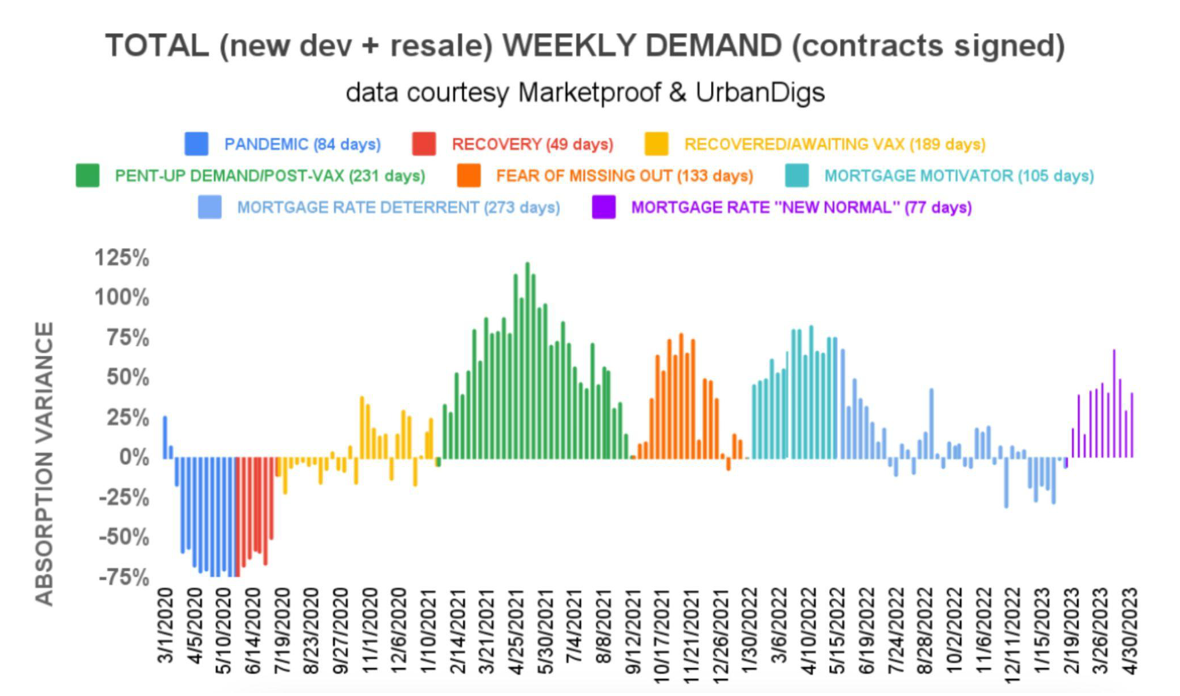
Chart Courtesy of UrbanDigs
Also, we’ve updated the bar chart above. The run in mortgage rates, which began in Q1-2022, is now divided into three distinct categories: “MOTIVATOR,” “DETERRENT,” and “NEW NORMAL.”
* the period January 5, 2015 to March 1, 2020.
Manhattan Supply: The chart below serves as an almanac, and this year is shaping up just like years past. This week, supply increased from 6,938 to 7,143 units, and that number should continue to increase en route to the June peak.
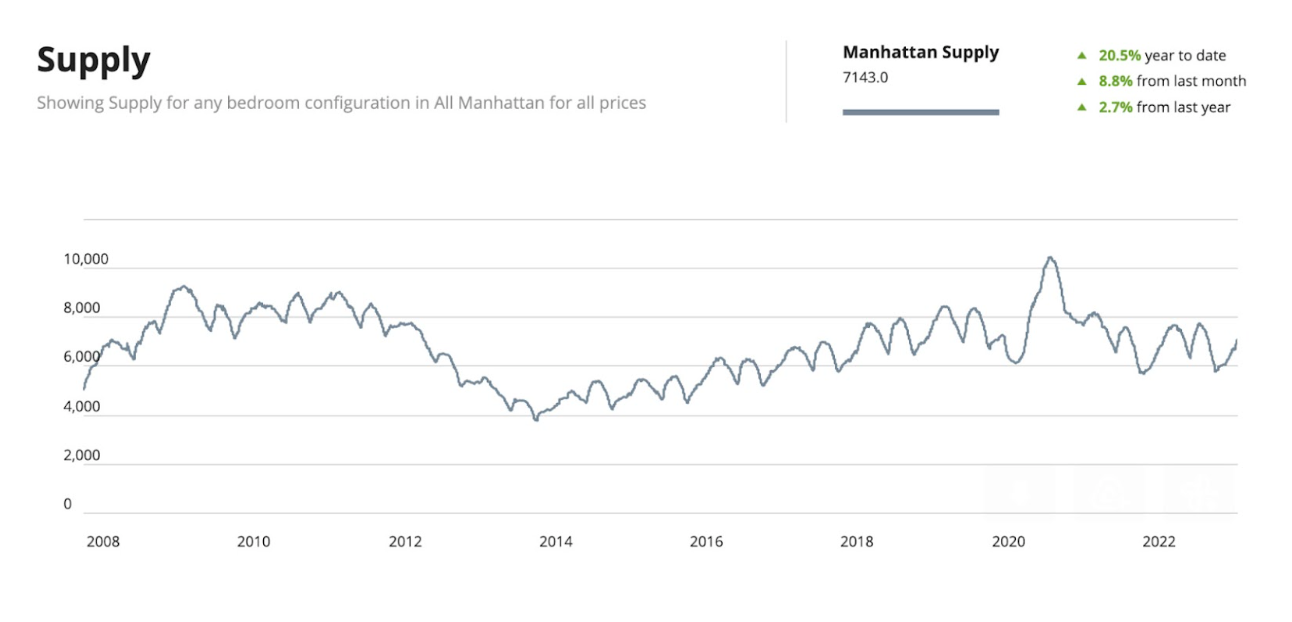
Chart Courtesy of UrbanDigs
Brooklyn Supply also exhibits a bi-annual cycle, although it’s not as apparent without Manhattan’s depth of historical data to clearly illustrate the trend. This week, supply in Brooklyn increased from 3,085 to 3,154 units, and that number should continue to increase as we head toward the June peak.
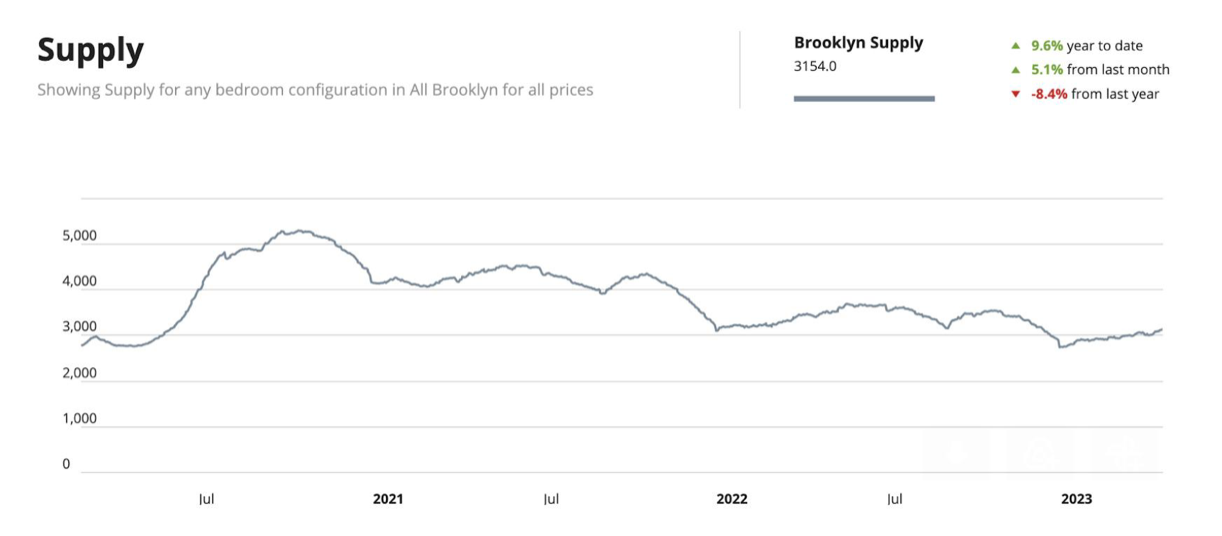
Chart Courtesy of UrbanDigs
Manhattan Pending Sales: Like the supply “almanac,” the historical pending sales chart gives us a clear picture of what to expect. Any deviation from the large peak in June and the smaller peak in December would certainly qualify as “news” and be reported. As expected, the metric increased week over week from 2,825 to 2,896 units as the borough heads toward its first peak.
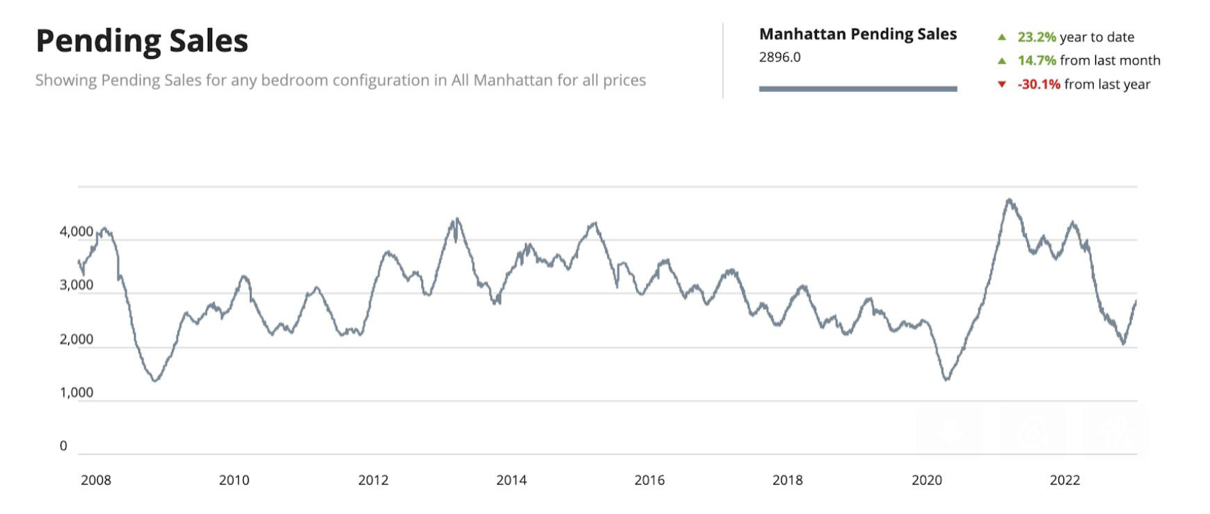
Chart Courtesy of UrbanDigs
Brooklyn Pending Sales: This week’s observation is the same as what we witnessed in Manhattan where, right on cue, the metric reached its seasonal February trough and then reversed direction. We can also predict that the first of two peaks this year should occur in June and that the metric is about halfway there. This week, pending sales increased from 1,700 to 1,801 units.
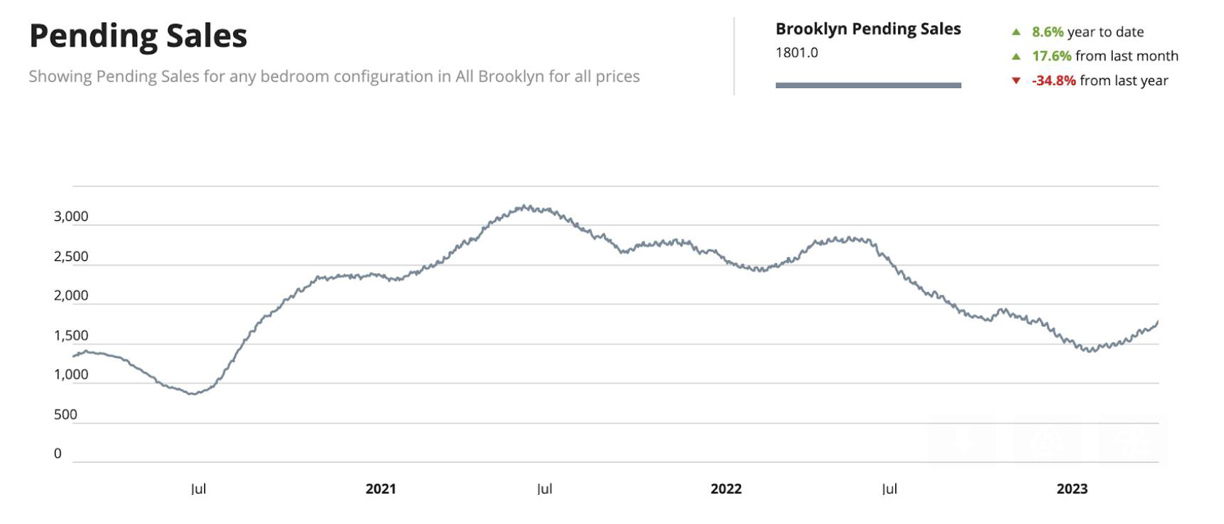
Chart Courtesy of UrbanDigs
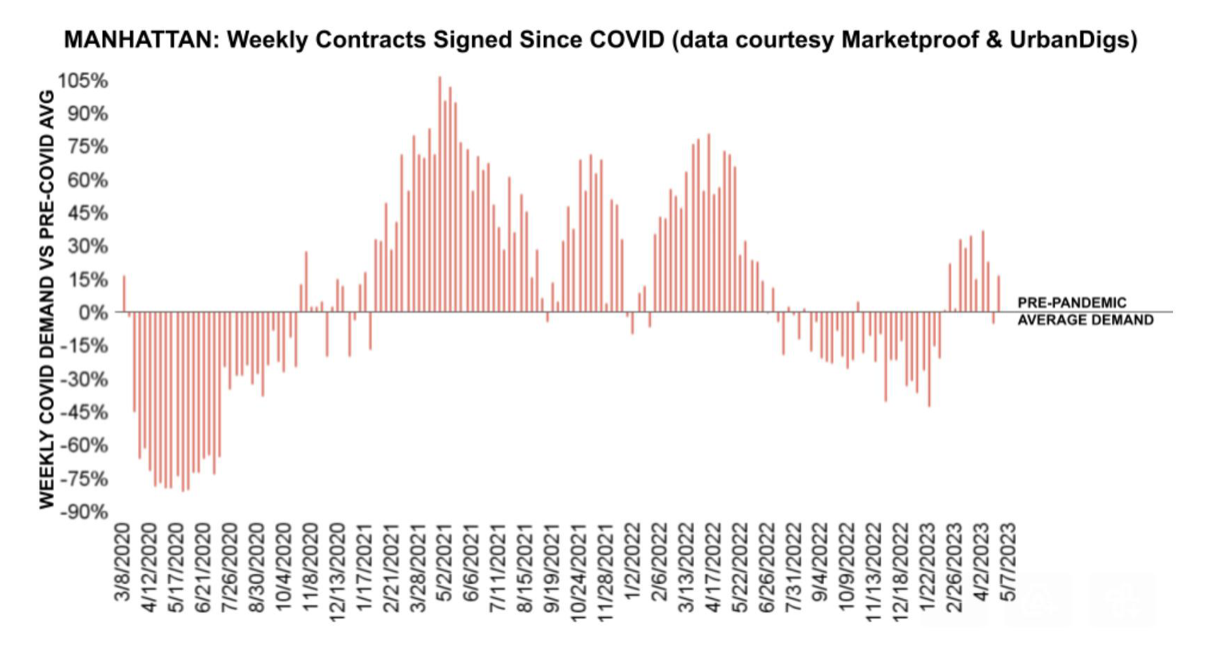
Manhattan Contracts Signed: After a brief relapse last week to below its pre-pandemic benchmark (the average weekly number of signed contracts from Jan 5, 2015 to Mar 1, 2020), the metric rebounded this week with 231 contracts signed.
Brooklyn Contracts Signed: Brooklyn is peaking again since the pandemic. After briefly touching the pre-pandemic average (the average weekly number of signed contracts from January 5, 2015 to March 1, 2020) in mid-January, which has become the metric’s support level for the past two years, signed contracts have skyrocketed above that average. This week, 159 contracts were signed.
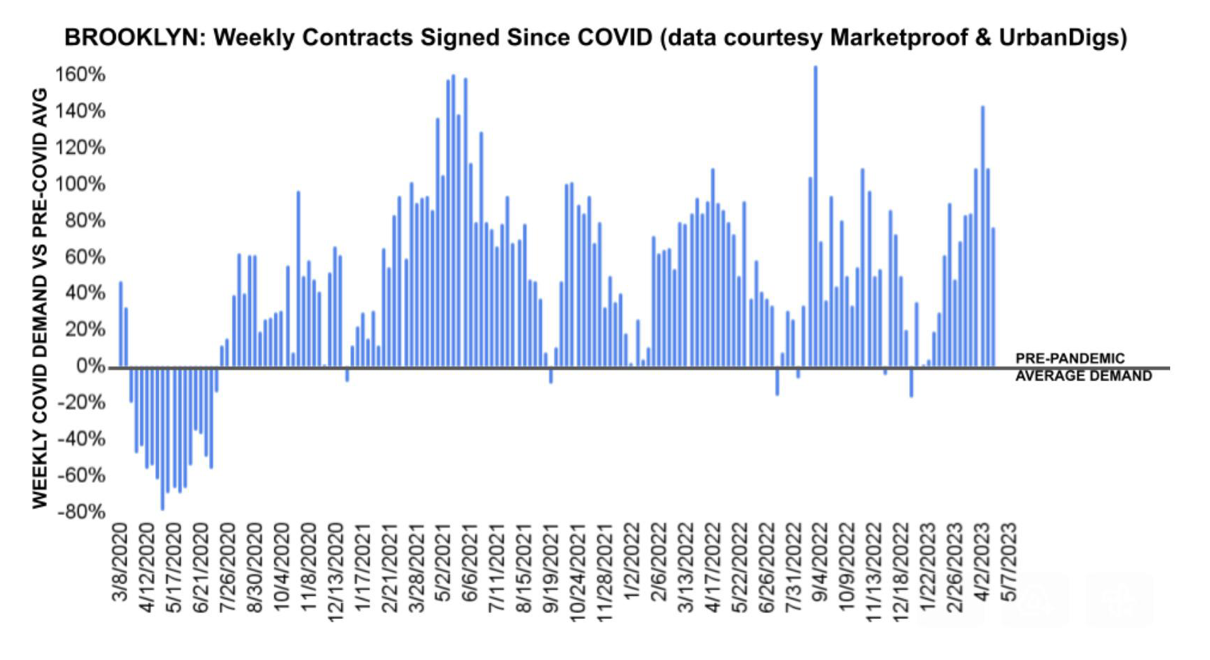
Chart Courtesy of UrbanDigs
New Development Insights
As reported by Marketproof, 54 new development contracts were reported across 44 buildings this week. The following were the top-selling new developments of the week:
- THE CORTLAND (West Chelsea)
- 300 WEST 30 STREET (Chelsea)
- 450 WASHINGTON (Tribeca)
- 611 W 56TH ST (Clinton)
- 1064 HANCOCK ST (Bushwick)
- NOVA (Long Island City)
If you would like to chat about the most recent market activity, feel free to contact us at info@elegran.com or connect with one of our Advisors.
About Us
Our goal is simple: to humanize the world of real estate. Michael Rossi founded Elegran in 2008 on the dual premise of motivation and innovation, with a third sustaining principle added over the years: care. Unique in the industry as an independently owned brokerage with agents known as “advisors” and a data-centered approach, the firm has become a key player in the New York brokerage world. The exclusive NYC member of the invitation-only Forbes Global Properties network, Elegran oversaw well over $500 million in sales volume in 2019, tripled market share in 2020, and sold US $1B in 2021. Headquartered in the center of Manhattan, Elegran is solely dedicated to serving the incomparable needs of the New York City metropolitan region. For more information about Elegran, visit www.elegran.com.
Categories
Recent Posts


Stay in the Know!
Sign up to receive our monthly newsletter
GET MORE INFORMATION